
Figure 4. Endogenous voltage-gated sodium currents are inhibited by sanshool in cultured sensory neurons.
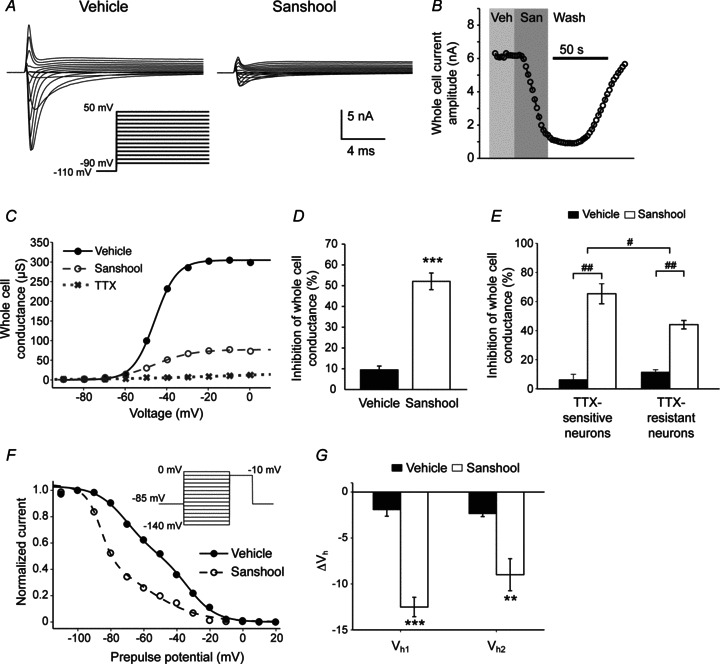
A, representative voltage-gated sodium current traces from dissociated dorsal root ganglion (DRG) neurons, in the absence (left) and presence of sanshool (right, 200 μm). Inset shows the voltage protocol for the traces. B, representative time course of sanshool-induced voltage-gated sodium current inhibition. 30 ms step pulses from −110 mV to −20 mV were applied at 2 s intervals. Holding potential was −85 mV. Veh, vehicle; San, sanshool; Wash, washout. C, whole-cell voltage-gated sodium conductance of a representative DRG neuron shown in A. Data points were fit with a Boltzmann function. D, percentage inhibition of peak conductance relative to baseline in the presence of vehicle (filled) or 200 μm sanshool (open). 200 ms step pulses from −110 mV to −10 mV were applied. n= 16. E, percentage of suppression of total maximum conductance after stepping from −110 mV to −10 mV. Neurons were classified according to sensitivity to TTX. n= 16. #P < 0.05, ##P < 0.01, n.s. not significant (two-way ANOVA, Tukey's HSD post hoc test). F, representative voltage-dependent steady-state inactivation curve of a DRG neuron, in the absence and presence of sanshool (200 μm). Voltage protocol (inset) consisted of a 100 ms prepulse step to indicated potentials from a holding potential of −85 mV, followed by a 10 ms step to −10 mV. Data points were fit with a double Boltzmann function (see Methods). G, average shift in the midpoints of the steady-state inactivation curves derived from double Boltzmann fits. n= 9. **P < 0.01, ***P < 0.001 (Student's t test). TTX, tetrodotoxin.