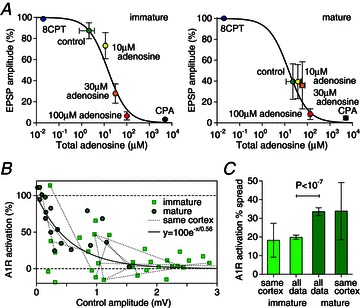
Figure 4. Endogenous adenosine concentrations increase over development and vary significantly between synapses.

A, average adenosine concentration–response curves with relative EPSP amplitude (E−Ecpa)/(E8cpt−Ecpa) versus total adenosine concentration (sum of bath-applied and estimated bath-applied-equivalent endogenous adenosine) for immature (N= 6) and mature (N= 4) connections. Amplitudes in the A1R antagonist 8CPT and agonist CPA were plotted at concentrations 0.05 μm and 500 μm for comparison. B, relative A1R activation (E8cpt−Econ)/(E8cpt−Eado) covaries with control amplitude (immature, squares; mature, circles) with an exponential fit capturing the trend. C, comparison of median spread across all data and spread in connections from the same neocortex (joined with dotted lines in B) for immature and mature synapses. The lack of significant difference between same neocortex data and all data provides evidence that the heterogeneity is at the level of L5PC connections rather than between individuals.
