
Figure 1. Period histograms as a function of modulation frequency and modulation depth for a single unit.
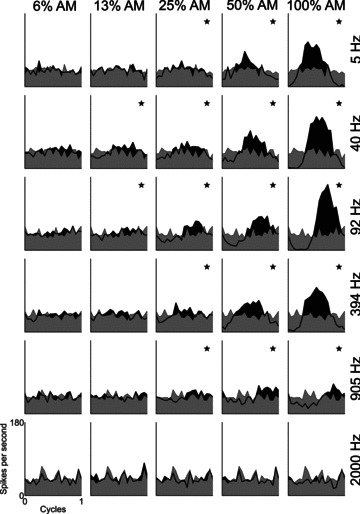
The period histograms are most modulated at high modulation depths. The lowest modulation depth at which significant modulation of the response occurs (*) varies with modulation frequency. At low- and high-modulation frequencies the response is less modulated than at the best modulation frequency (92 Hz). Primary-like unit, BF = 7.87 kHz, BMF = 92 Hz. Data shown were recorded in response to signals presented at 10 dB above pure-tone threshold. Grey shaded area indicates the response to an unmodulated pure tone. Black shaded area and think black line indicates the response to the modulated tone. Modulation depth is indicated at the top of each column. Modulation frequency is indicated to the right of each row. * in the top-right corner of each plot indicates significant phase-locking to the modulation frequency (P < 0.001, Rayleigh statistic > 13.8). Binwidth = 0.05 cycles.