
Figure 4. Modulation gain at BMF, as a function of modulation depth (m) and sound level, for a population of PL, CT, and CS units.
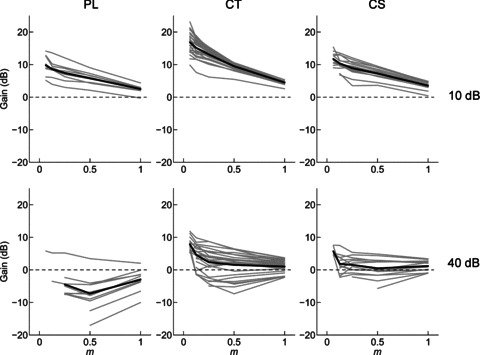
Gain decreases monotonically with increasing modulation depth and with increasing sound level. Grey lines, single-unit data. Black lines, population mean, calculated from the single-unit data. Top row, 10 dB above pure-tone threshold. Bottom row, 40 dB above pure-tone threshold. Dashed line in each plot indicates zero gain.