
Figure 5. Modulation gain as a function of normalised modulation frequency (fm), modulation depth (m) and sound level, for a population of PL, CT, and CS units.
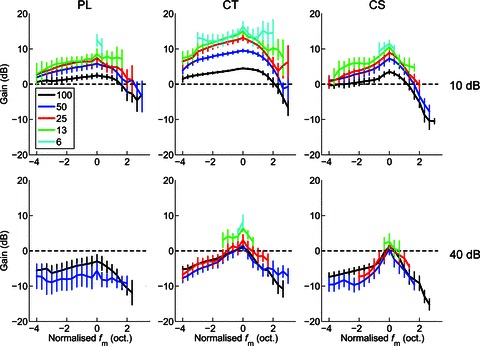
Gain increases with decreasing modulation depth (shown in key at top left, %). CT units show the highest gain, followed by CS units, and then PL units. Gain decreases (and becomes negative) with increasing sound level. Top row, at 10 dB above pure-tone rate threshold. Bottom row, at 40 dB above pure-tone threshold. Left column, primary-like (PL) responses. Middle column, transient chopper (CT) responses. Right column, sustained chopper (CS) responses. Dashed line indicates zero response modulation gain relative to the signal modulation. Data are population mean data calculated over significant portions of the tMTF (i.e. where Rayleigh > 13.8, P < 0.001). Error bars indicate 95% confidence intervals around the population mean.