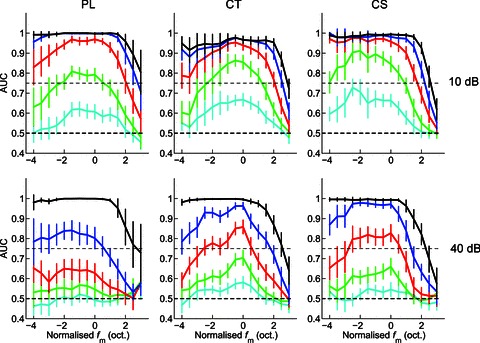
Figure 9. Mean area under the receiver operating characteristic curves (AUC) as a function of normalised modulation frequency (fm), modulation depth, and sound level, for a population of PL, CT, and CS units.

The area under the ROC curve decreases with decreasing modulation depth and with increasing sound level. This corresponds to a decreasing ability of neurons to discriminate between modulated and unmodulated signals by means of spike synchrony at fm as modulation depth decreases, and as sound level increases. Colour key as in Fig. 8. Top row, at 10 dB above pure-tone threshold. Bottom row, at 40 dB above pure-tone threshold. Left column, primary-like (PL) responses. Middle column, transient chopper (CT) responses. Right column, sustained chopper (CS) responses. Dashed line at AUC = 0.5 indicates chance performance. Dashed line at AUC = 0.75 indicates threshold for AM detection (i.e. AUC significantly different from 0.5). Error bars indicate 95% confidence intervals around the population mean.
