
Figure 5. Comparison of ML interneuron-mediated inhibitory neurotransmission onto Purkinje cells (PCs) between WT and Atp1a3+/−.
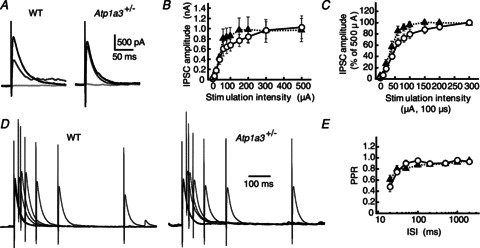
A, representative traces of IPSCs recorded from a single PC of WT and Atp1a3+/−. The IPSCs were evoked by electrical stimulation with a series of different intensity (from 10 to 500 μA for 100 μs), and superimposed for stimulations at 10 (pale grey lines), 60 (dark grey lines) and 500 μA (black lines). Each trace is derived from averaging the IPSCs of several successive traces recorded every 15 s. Stimulation artifacts were truncated for clarity. B, relationship between IPSC amplitude and stimulation intensity for WT (open circles, n= 12) and Atp1a3+/− (filled triangles, n= 11). Data are mean ± SEM. C, relationship between IPSC amplitude and stimulation intensity of WT (open circles, n= 12) and Atp1a3+/− (filled triangles, n= 11). Data are relative to the amplitude examined at stimulation intensity of 500 μA. Note the significantly higher response to the weak stimulation intensity in Atp1a3+/−. D, representative averaged traces of IPSCs examined by the paired-pulse protocol in PCs of WT and Atp1a3+/−. The traces were normalized relative to the peaks of the first IPSC. E, relationship between the paired-pulse ratio (PPR) and the inter-stimulus intervals (ISI) for IPSCs examined in WT (open circles, n= 11) and Atp1a3+/− (filled triangles, n= 12).