
Figure 6. Characterization of miniature IPSCs (mIPSCs) in Atp1a3+/− compared with WT.
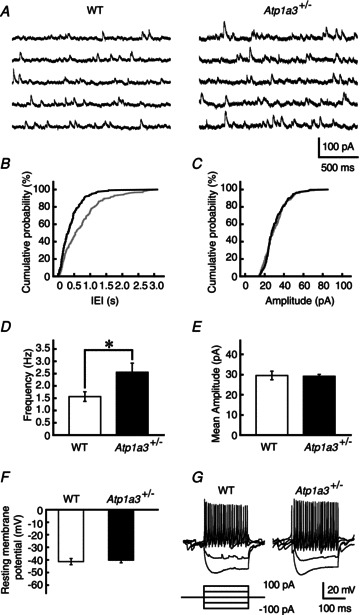
A, successive traces of mIPSCs recorded from single PCs of WT and Atp1a3+/− in the continuous presence of TTX (1 μm) and CNQX (20 μm). B and C, cumulative distribution of the inter-event intervals (IEI in B) and amplitude of mIPSCs (C) of WT (grey lines) and Atp1a3+/− (black lines). Data were calculated from the trace in A. Note the significant leftward shift in the IEI distribution in the Atp1a3+/− (P < 0.001, Kolmogorov–Smirnov test in B) without a change in the amplitude distribution (P= 0.33, Kolmogorov–Smirnov test in C). D and E, comparison of the frequency (D) and mean amplitude (E) between mIPSCs recorded from PCs of WT (open bar, n= 13) and Atp1a3+/− (filled bar, n= 12). F, comparison of the resting membrane potential of ML interneurons between WT (open bar and circles, n= 12) and Atp1a3+/− (filled bar and triangles, n= 11) (P= 0.46, unpaired t test). G, representative traces of voltage responses recorded from single ML interneurons from WT and Atp1a3+/−. Each trace is derived from several successive traces recorded by the current-clamp technique. Current injection protocol is shown under the trace. Data are mean ± SEM. *P < 0.05.