
Figure 3.
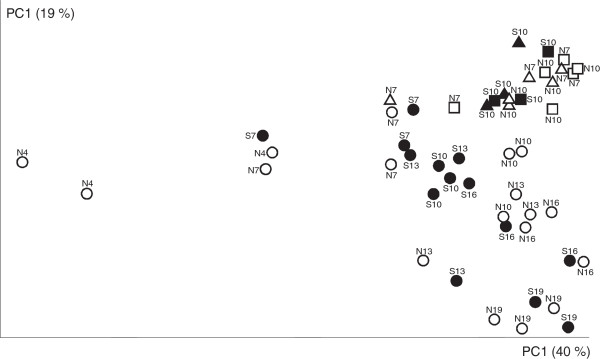
PCoA of infected and non-infected chickens. Circles, individual chickens and their cecal microbiota from experiment 1. Squares, chickens and their mucosa-associated microbiota from experiment 2. Triangles, chickens and their luminal microbiota from experiment 2. Black symbols - infected chickens, white symbols – non-infected chickens. Numbers indicate age of individual chickens.