
Figure 4.
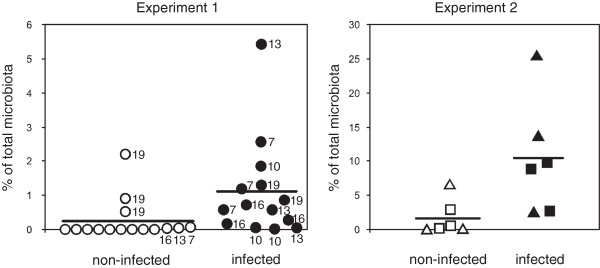
Relative representation of Lactobacillus ultunensis (experiment 1) and Lactobacillus gasseri (experiment 2) in the chicken cecum with or without S. Enteritidis infection. Circles, percentage of L. ultunensis out of the total microbiota in individual chickens in experiment 1. Squares, percentage of L. gasseri from the mucus-associated microbiota in the cecum of individual chickens in experiment 2. Triangles, percentage of L. gasseri from the luminal microbiota in the cecum of individual chickens in experiment 2. Black symbols - infected chickens, white symbols – non-infected chickens. Numbers, indicate the age of individual chickens. Age of the chickens is not shown for L. ultunensis negative chickens in experiment 1, and chickens in experiment 2 as all these chickens were ten days old. The horizontal line in each experiment represents the mean of all chickens. Comparisons of Lactobacilli prevalence in both the experiments by t-test came out as significantly different at p<0.05.