
Figure 2.
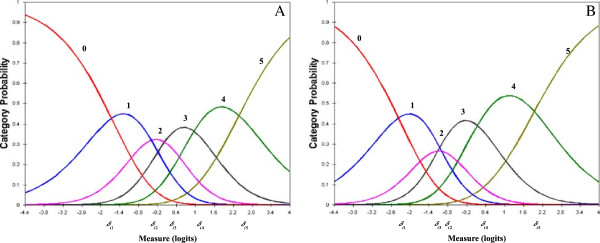
The response category probability curve for a five-step item. (A) An example of a well-functioning category response (item 4), showing a monotonic increase of the thresholds (δ) in the order of the logits level. (B) An example of a poorly-functioning category response (item 6), showing a disordering of the thresholds, and with the ordering of the δi2 (categories between 2 and 3) and δi3 (categories between 3 and 4) reversed.