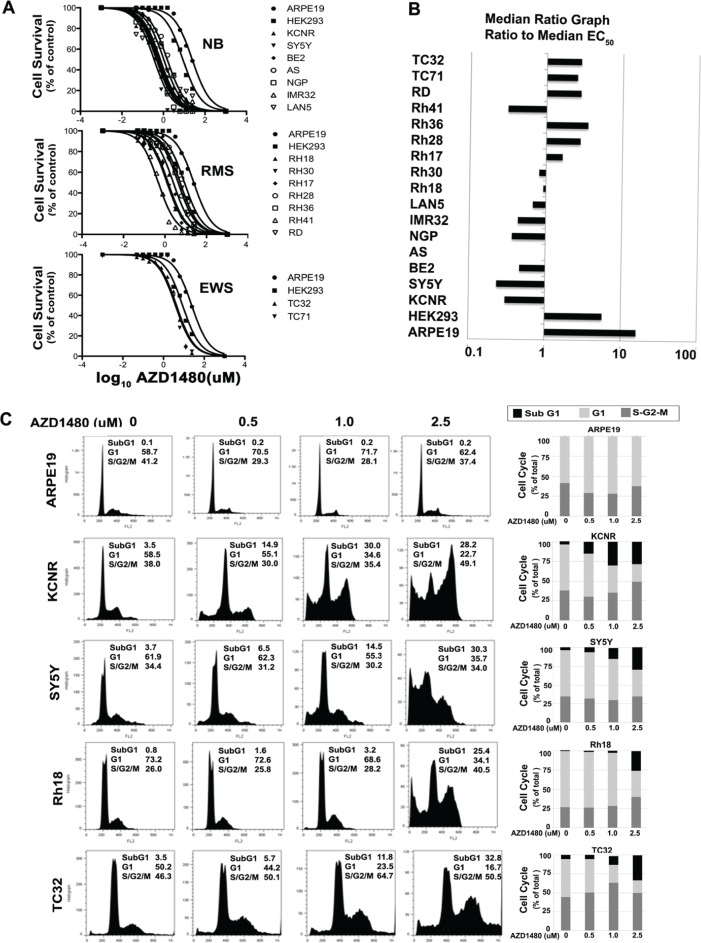
Figure 1. The effects of AZD1480 on high-risk pediatric tumor cell lines in vitro.
A) Typical growth inhibition curves determined by MTS assays for the NB, RMS and ESFT tumor cell lines compared with normal control ARPE19 and HEK293 cell lines. B) The median EC50 ratio graph shows the relative EC50 values for all the cell lines tested. Each bar represents the ratio of the panel EC50 to the EC50 value of the indicated cell line. Bars to the right represent cell lines with less sensitivity, while bars to the left indicate cell lines with higher sensitivity to AZD1480. C) Effect of AZD1480 on the cell cycle of pediatric solid tumors. Two NB cell lines (KCNR and SY5Y), one RMS cell line (Rh18), one ESFT cell line TC32 and the normal ARPE19 cell line were treated with various concentrations of AZD1480 (0, 0.5, 1 and 2.5 μM) for 72 hours. Cells were stained with propidium iodide and analyzed by flow cytometer. Results are tabulated within the graph and graphically shown in histograms (left). The bars represent the percentages of cells different phases of the cell cycle; sub-G1 (black), G1 (light grey) and the S + G2/M phase (dark grey).

