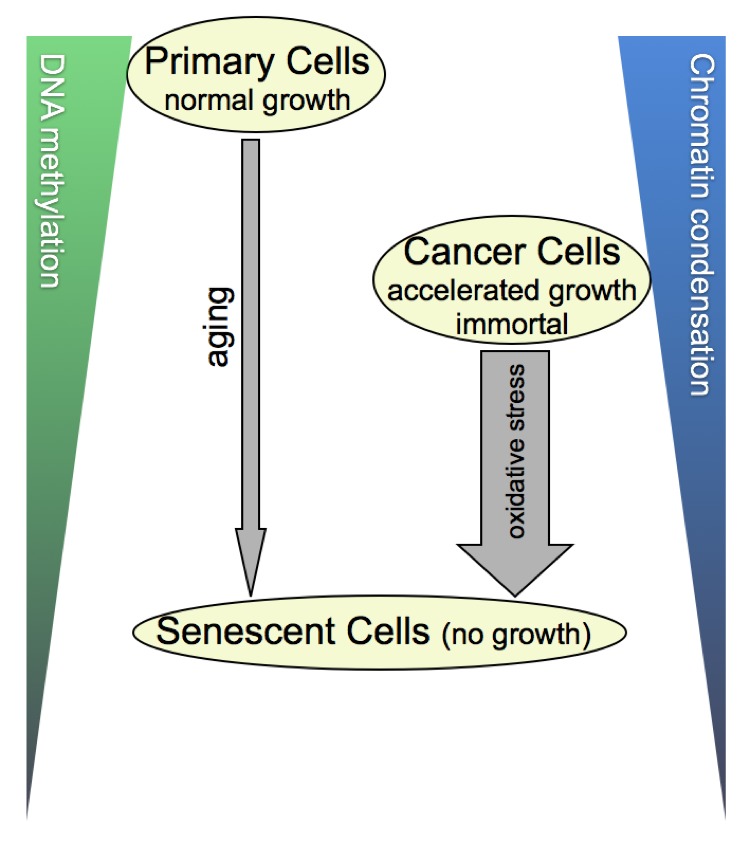
Figure 7. Cellular DNA methylation and concurrent chromatin condensation levels.

The illustrated scheme is derived from the 3-D image- and flow-cytometrical results of our cell-by-cell study, summarizing the correlations we found. In a nutshell, cancer cells with an accelerated growth behavior compared with their normal counterparts take a meta-stage in global DNA methylation and chromatin condensation levels between the latter and senescent cells that have reached growth arrest. As benign primary cells seem to reach cancer-cell equivalent stages of the two parameters at some point in aging, this calls the question as to whether the underlying sequence of molecular profiles may differ between the two categories of cells. Along the same lines of thought, it would be informative exploring this matter also for SIS, which is depicted as a shorter but more forceful process (thick arrow) than gradual aging (thin arrow).
