
Fig. 8.
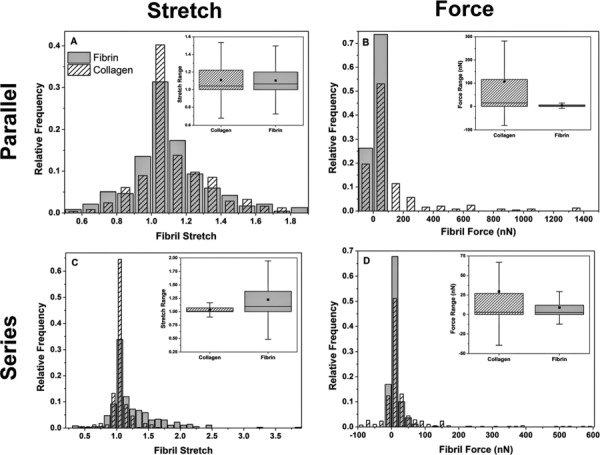
Fibril stretch and fibril force distributions in the parallel and series models after the macroscopic stretch. In the parallel model, the collagen and fibrin networks exhibit similar fibril stretch distributions, however, forces in the collagen fibrils are much larger than those in the fibrin fibrils. In the series model, a much smaller difference between the collagen and fibrin fibril force distributions is observed, however, fibrin fibrils bear a larger proportion of macroscopic stretch. Distributions are of 54% C networks, taken from an RVE at a Gauss point after the final stretch step. The ■ in the box plots represent the distribution mean and whiskers represent outliers within the interquartile range.