
Figure 2. Auditory, somatosensory and bimodal event related responses.
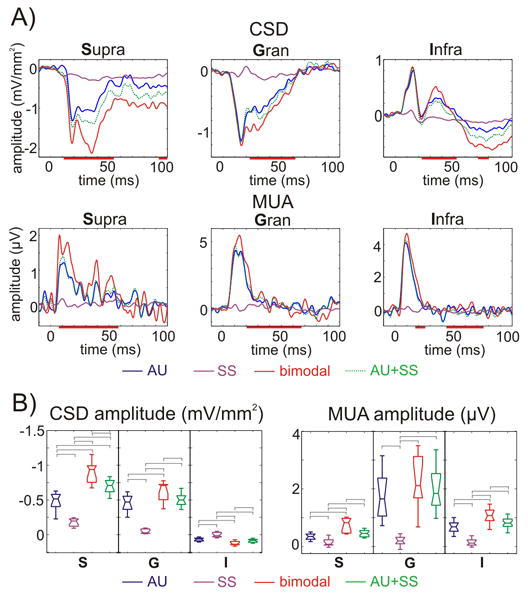
A) CSD (upper) and MUA (lower) responses to auditory, somatosensory and bimodal stimuli on the selected supragranular (S), granular (G), and infragranular (I) channels (from the same site as Fig. 1). Green dotted line shows the arithmetic sum of the unimodal responses. Red lines on the time-axis denote time intervals where the averaged bimodal responses were significantly (independent-samples t-tests, p<0.01) greater than the sum of the averaged unimodal responses in the pooled data (n=38). B) Box-plots show pooled (n=38) CSD and MUA amplitudes on the selected channels (S, G, and I) averaged for the 15–60 ms time interval for the same conditions as panel A. Brackets indicate the significant post hoc comparisons calculated using Games-Howell tests (p<0.01).