
Figure 3.
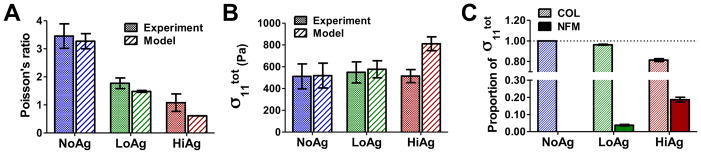
Model-predicted values of (A) Poisson’s ratio and (B) Cauchy stress in the 1-direction showed qualitative comparison with experimental values; (C) while stress in the NoAg samples was due (trivially) to collagen (COL) alone, the non-fibrillar matrix (NFM) contributed a small and moderate proportion of the total stress to the LoAg and HiAg groups, respectively (plots show mean ± 95%CI; n=5–7/group)