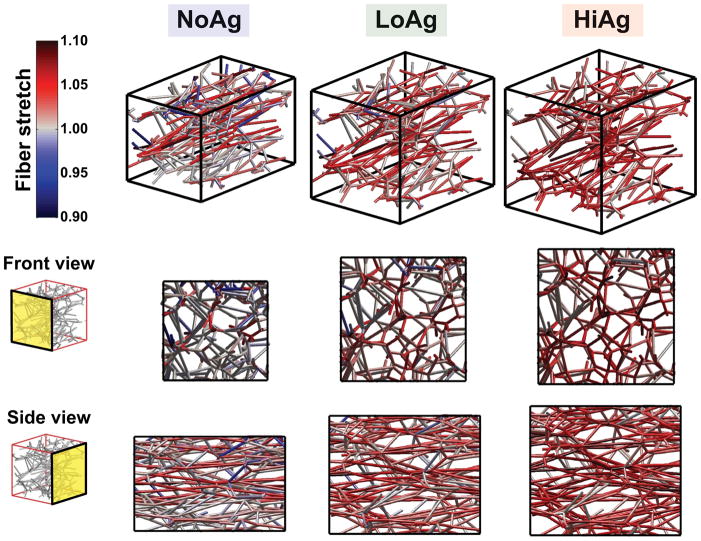
Figure 4.
3D maps (and 2D projections) show how network organization and fiber stretch for a representative network changed as a function of NFM quantity: the amount of network compaction decreased and relative fiber stretch increased as NFM increased from NoAg to LoAg to HiAg (gray = unstretched relative to undeformed case, red = tensile stretch, blue = compressive stretch)

