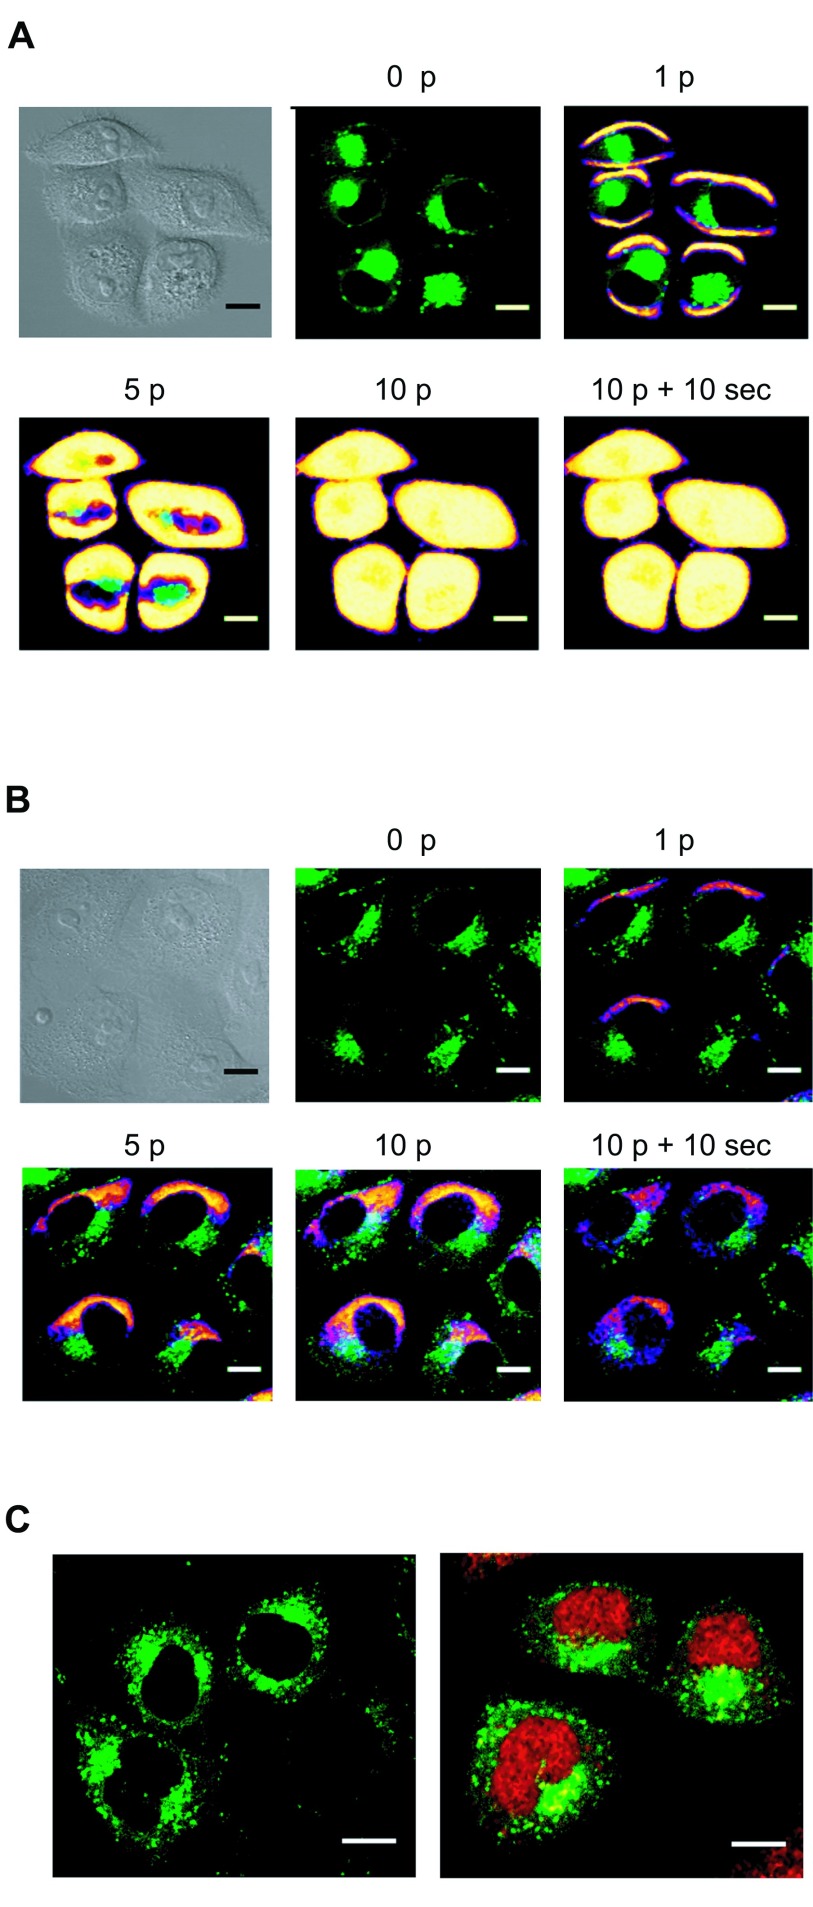
Figure 2.
Visualization of Cy5-LNA/DNA oligomer electrotransfer by direct confocal fluorescence microscopy. Plated Hela GFP-Rab7 cells were pulsed (0.3kV/cm, 10 pulses (p) of 5ms, 1Hz) on a glass coverslip chamber under a confocal microscope in presence of PI (100µM) (A) or Cy5-LNA/DNA oligomer (250nM) (B). Scan series were carried out before (0p), during (1p, 5p and 10p) and 10sec after (10p + 10sec) pulses application. The anode was located on the bottom of the pictures. Scale bare = 10µm. Pictures of PI and Cy5 fluorescence are in pseudo-color, GFP fluorescence is in green and gray pictures are light transmission acquisition. C. Intracellular localization of Cy5-LNA/DNA oligomers 2min after its application in non-pulsed cells (left picture) and in pulsed cells (right part). Scale bare = 10 µm. Cy5 and GFP fluorescence are in red and green respectively.

