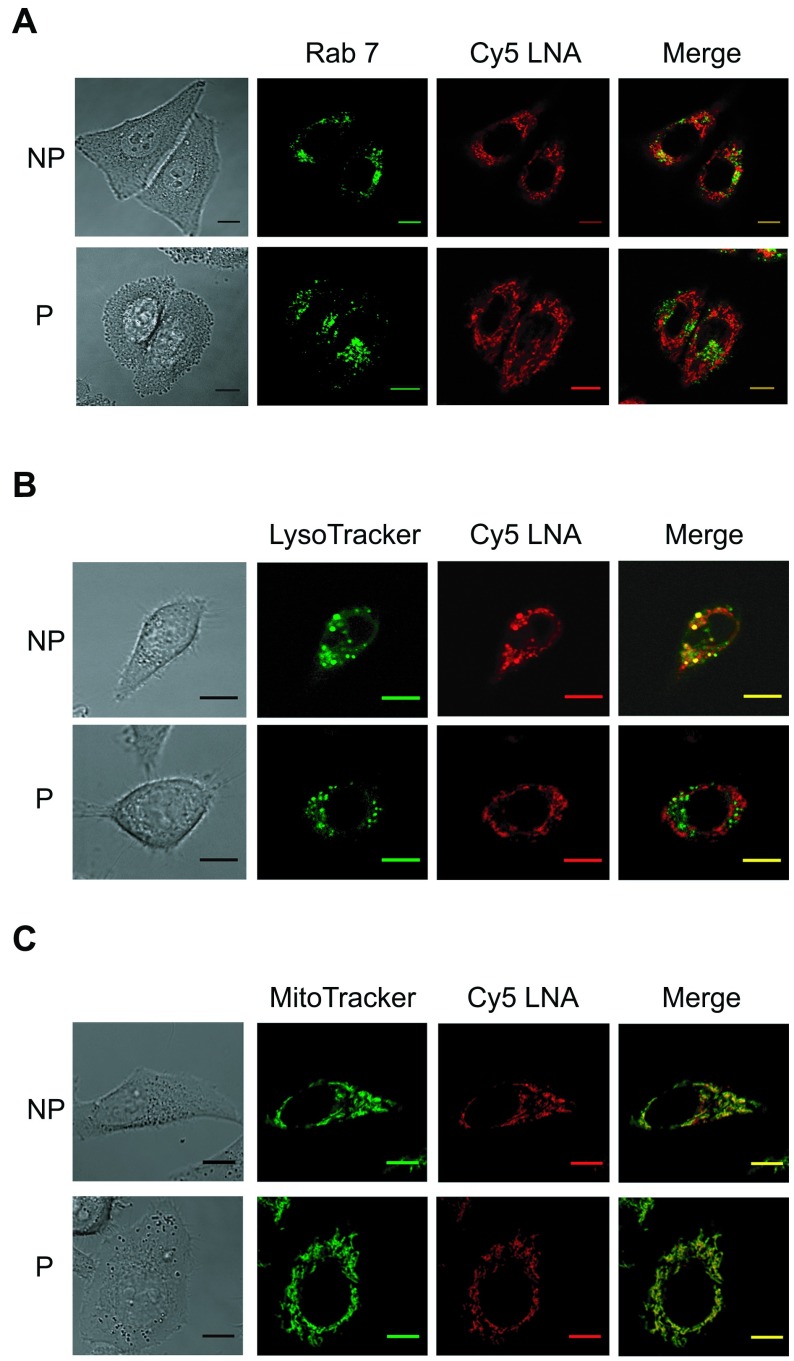
Figure 4.
Sub-cellular distribution of Cy5-LNA/DNA oligomer at 24hr. A. Plated HeLa GFP-Rab7 cells were pulsed (P) (0.3kV/cm, 10 p of 5ms, 1Hz) or not (NP) in the presence of Cy5-LNA/DNA oligomer (250nM). Confocal images were recorded 24hr after the treatment. Scale bar = 10μm. Representative pictures of GFP and Cy5 fluorescence are in green and red respectively and gray picture is light transmission acquisition. B and C. HeLa cells were treated as described above and labeled the following day either with Lysotracker® Green DND-26 (B) or Mitotracker® Green FM (C). Representative pictures of Lysotracker® Green DND-26 and Mitotracker® Green FM fluorescence are in green, Cy5 fluorescence is in red and gray pictures are light transmission acquisition. Scale bar = 10μm.

