Figure 2.
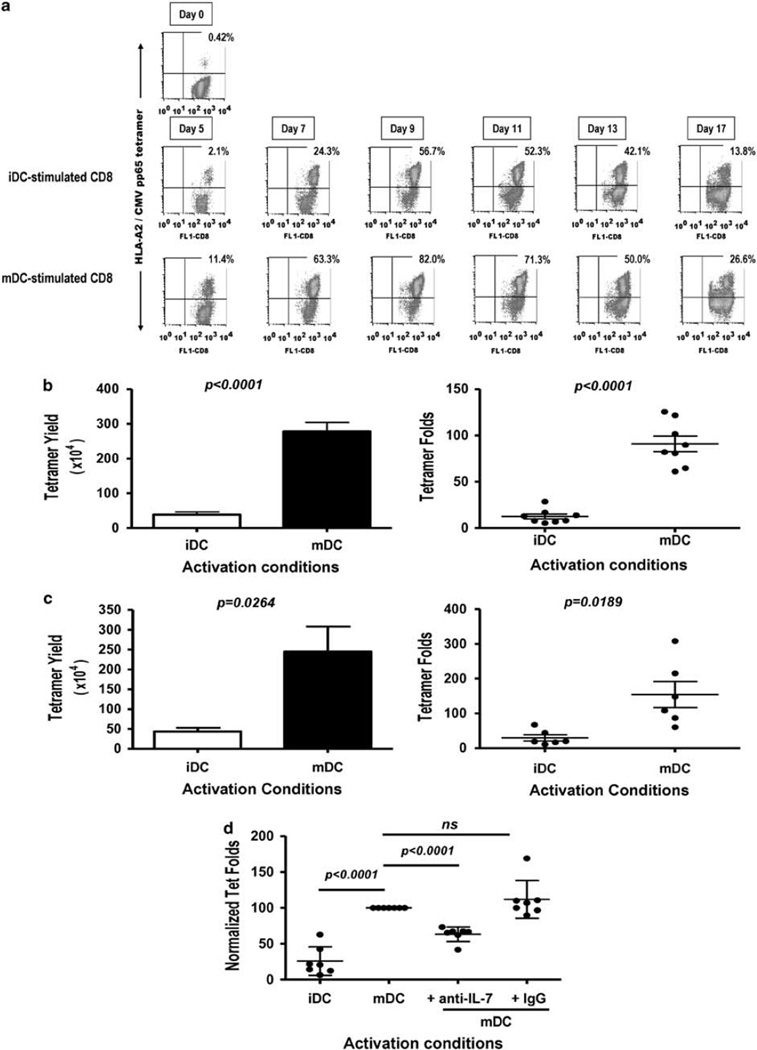
IL-7 neutralization decreases the CMV pp65-specific CD8 T-cell peak response upon mature dendritic cell (mDC) stimulation, (a) Purified CD8+ T cells were in vitro stimulated with CMV pp65 495–503 NLV peptide-pulsed immature DC (iDC) or mDC. Human IL-2 (10 U well−1) was added 48h after stimulation and every 2–3 days thereafter. Cells were harvested on the indicated days, counted and stained with fluorescence isothiocyanate (FITC)-CD8 antibody (Ab) and phycoerythrin (PE)-HLA-A2/CMV pp65 peptide tetramer. Numbers in dot plots represent percentage of tetramer-positive (tet+) cells among lymphocyte/CD8-gated cells. A representative donor is shown (n=3). (b) Tetramer yield and fold increases in NLV peptide-specific CD8+ T cells upon peptide DC stimulation. Tetramer yield represents the percentage of tet+ T cells×total CD8+ T cells at day 9; tetramer fold represents tetramer yields/percentage of tet+ T cells×total CD8+ T cells at day 0. Each dot represents value obtained with an individual well/culture condition; horizontal bars represent mean values + s.e.m. A representative donor is shown (n=3). P-values were obtained with the Student’s t-test; P-values <0.05 are significant. Each individual well is harvested and counted separately and the mean ± s.e.m. is determined for both iDC and mDC groups. The coefficient of variation among wells (in both groups) is <15% for tetramer yields, (c) Tetramer yield and fold in NLV peptide-specific responses among individuals. Cultures were analyzed as described in (a and b). Tetramer yield and fold increases were calculated using a sample pooled from eight wells per culture condition per individual (represented by each dot). Six representative individuals are shown, (d) NLV peptide-pulsed mDCs were pre-incubated with anti-IL-7 Ab (1 µg ml−1), isotype control Ab (1 µg ml−1) or media for 1 h at 37°C before addition of T cells. Cells were harvested on day 9, stained with FITC-CD8 Ab and PE-HLA-A2/CMV pp65 tetramer, analyzed by fluorescence-activated cell sorting (FACS) and tetramer folds calculated using a sample pooled from eight wells per culture condition. For comparison among individuals, each individual’s tetramer fold values were normalized to those obtained in mDC-activated cultures. Each dot represents an individual and horizontal bars represent mean values ± s.d. P-values were obtained with the repeated measure analysis of variance (ANOVA) followed by Tukey’s analysis; P-values <0.05 are significant (n=8).

