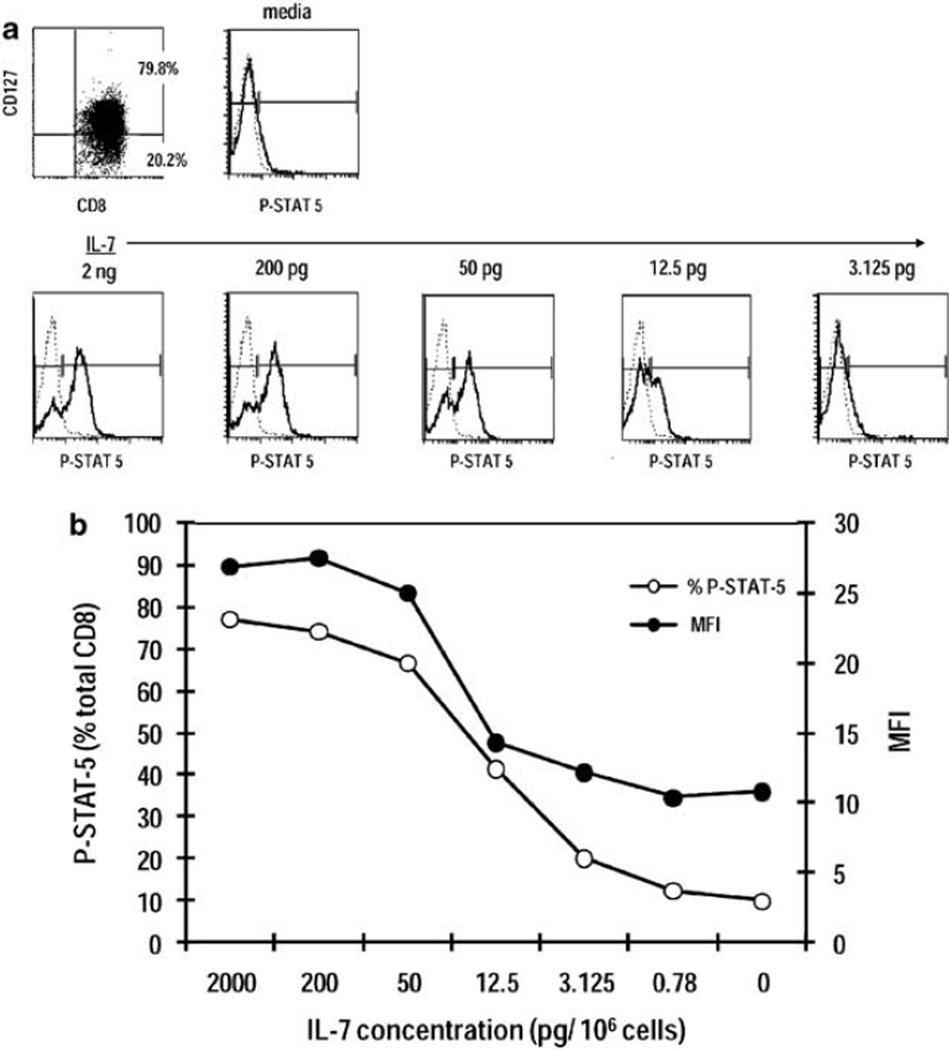
Figure 6.
STAT-5 phosphorylation as a measurement of CD8+ T-cell responsiveness to IL-7. Purified CD8+ T cells were stained for IL-7Rα (CD127) expression or activated with the indicated concentrations of IL-7 for 30 min and stained for the phosphorylated form of STAT-5 (Y-649). (a) Representative histogram plots depict IL-7Rα expression on CD8+ T cells and P-STAT-5 staining relative to isotype control upon treatment with increasing concentrations of IL-7. (b) Quantitation of percentages of CD8+ T cells expressing P-STAT-5 and ΔMFI at each IL-7 concentration was tested. ΔMFI represents staining intensity with anti-P-STAT-5 minus isotype control antibody (Ab).

