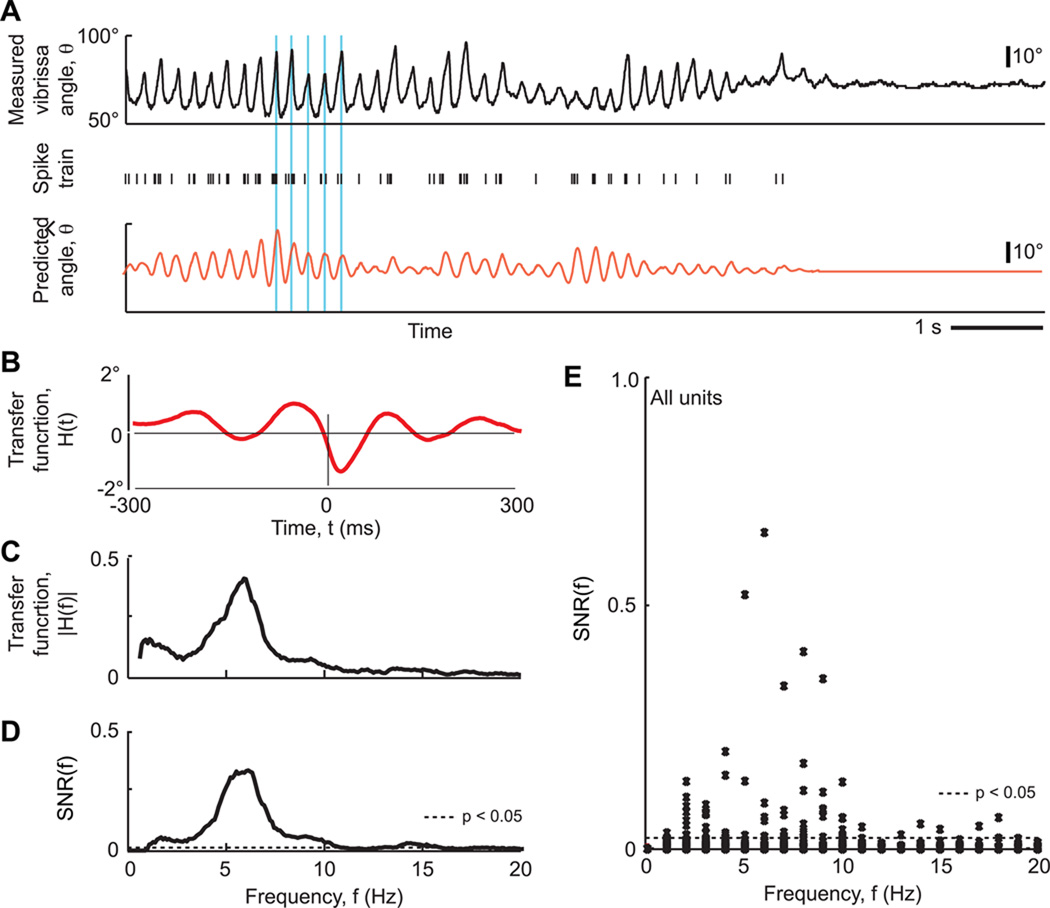
Figure 2. Absence of a strong linear relation between spike trains and whisking behavior.
(A) Example of measured vibrissa position and concurrent single-unit spike train, together with the vibrissa position predicted from the spike train. The time-domain representation of the transfer function is shown in the lower right. Blue vertical lines are a visual guide to the correspondence between predicted and measured phase. Note the strong tracking of phase, the weak tracking of amplitude, and the loss of the value of the offset. (B) The representation of the transfer function in the time domain. (C) The same transfer function versus frequency. (D) The SNR(f) of the transfer function of the same unit. Horizontal line is cutoff for significance. (E) The SNR(f) for all units. Horizontal line is cutoff for significance.

