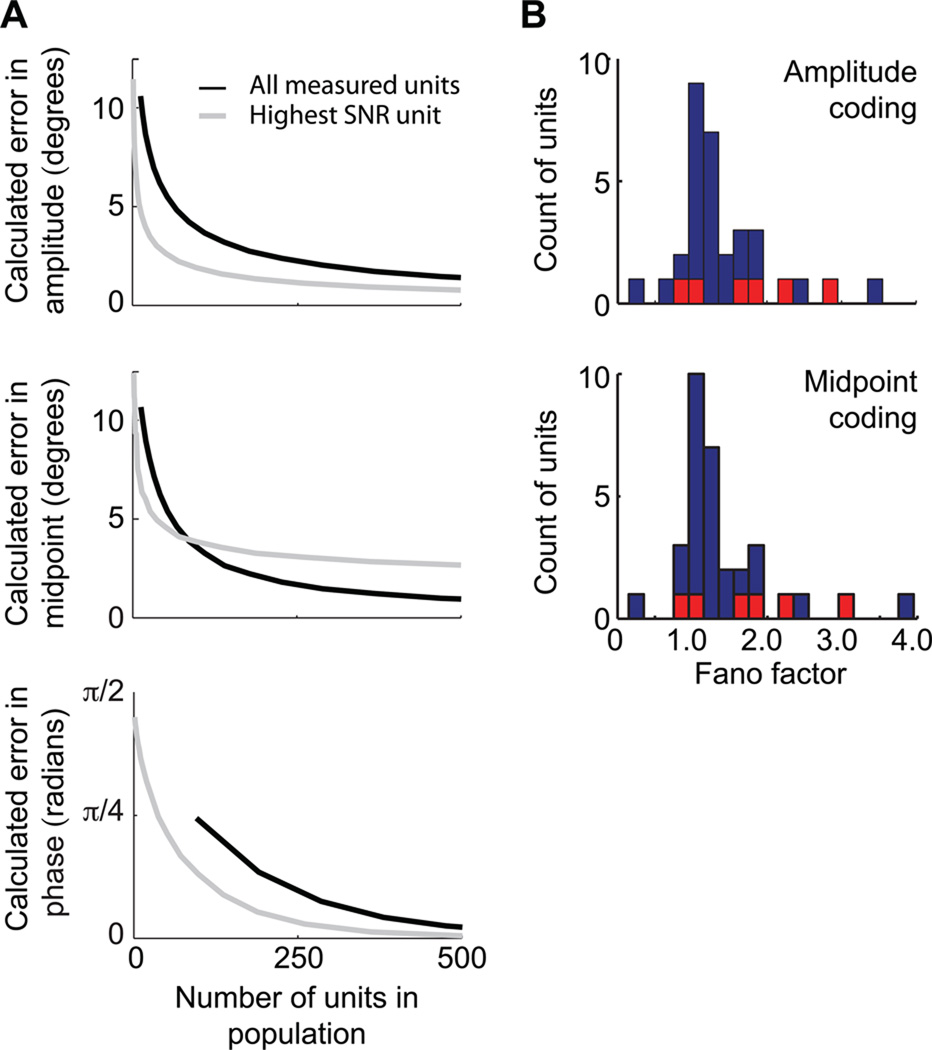
Figure 6. Estimated accuracy of coding as a function of population size.
(A) Simulations of neuronal populations were either based on the entire measured data set (black line) or only on the unit with the highest recorded modulation (gray line). Errors were drawn from 1000 simulations of each value and weighted by their prior distributions. Top row. Mean error for amplitude estimation assuming a firing rate code and an integration time of T = 0.25 s. Middle row. Mean error for midpoint estimation assuming a firing rate code and an integration time of T = 0.25 s. Bottom row. Mean error for phase estimation assuming a linear code. (B) Histograms of the Fano factors computed in a 0.25 s window for all units; F = 1.0 is the limit of a Poisson counting process. The colored points correspond to fast spiking units (Fig. S3).

