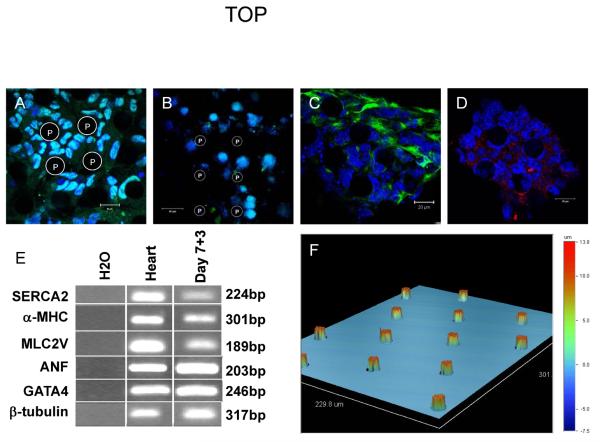
Figure 1. Heterogeneity of unselected ES cell progeny are unaffected by microprojections.
Confocal images (A–D) and RT-PCR (E) showing pluripotentcy and distinctive differentiation lineage markers. Immunochemistry showing pluripotent (A) Oct-4 (green) and (B) SSEA-1 (green) expression, as well as differentiation markers (C) nestin (green) and (D) brachyury (red) on PDMS membranes with microprojections. (E) RT-PCR analysis of selected transcripts in embryoid bodies three days after plating. (F) Optical profilometry of microprojections. (A–D) Nuclei are blue. (A,C,D) Scale bar 20 μm, (B) scale bar 50 μm. (A,C,D) T35-15 PDMS, (B) T75-15 PDMS. P, microprojections.

