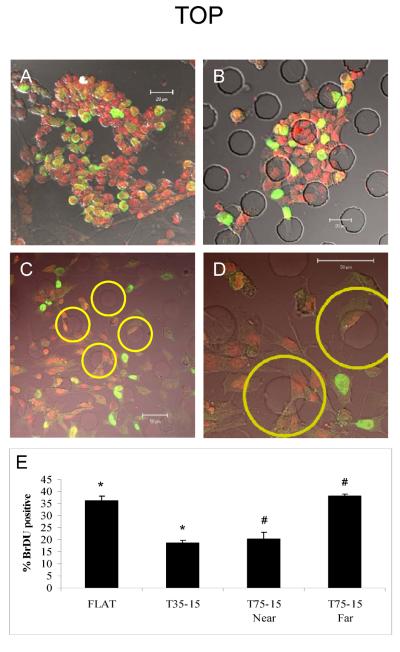
Figure 2. Attenuation of mES cell-derived progeny proliferation by 15 μm microprojections.
Merged confocal and phase images of BrdU incorporation in cells on flat (A) or topographied (B–D) PDMS membranes. (A) Flat, no microprojections; (B) T35-15, all cells near a microprojection; (C) T75-15, some cells near microprojections others are far from a microprojection; (D) higher magnification of C. Yellow circles are drawn 15 μm from the edge of all microprojections and used to determine near/far parameter. All cells within yellow circles are considered near a projection and those outside are considered far from a projection (E) Histogram comparing BrdU incorporation in cells on different topographies. Green – BrdU. Red - Propidium Iodide. Data are mean ± SE. *, # p< 0.005

