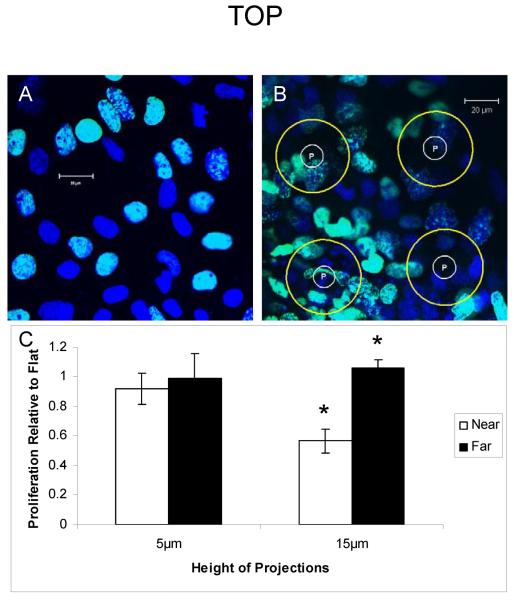
Figure 3. Microprojection height of 5 μm does not attenuate mES cell-derived progeny proliferation.
EdU labeling of mES cells on flat (A) or T75-5 (B) PDMS membranes. P represents microprojection. Yellow circles are drawn 15 μm from microprojection edge and used to determine near/far parameter of cells. (C) Histogram showing influence microprojection height has on proliferation compared to cells grown on flat membranes. Green – EdU. Blue – 4,6-diamidino-2-phenylindole (DAPI). Green+blue gives turquoise color. Data are mean ± SE. * p< 0.01.

