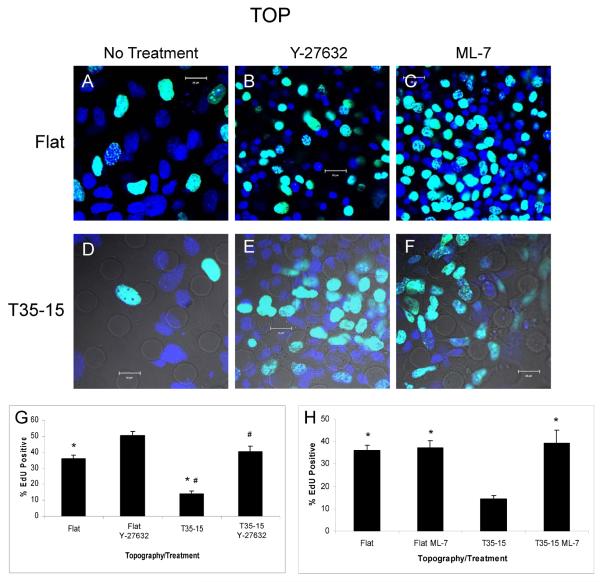
Figure 4. Inhibition of stress fiber formation eliminates proliferation blunting effect of microprojections.
Confocal image of EdU labeling in mES cells on flat (A–C) or T35-15 (D–F) PDMS membranes. (A,D) Control cells not treated with inhibitor. (B,E) Cells treated with Rho kinase inhibitor, Y-27632. (C,F) Cells treated with myosin light chain kinase inhibitor, ML-7. (G) Histogram comparing proliferation of mES cell-derived progeny treated with Y-27632 when grown on different topographies. (H) Histogram comparing proliferation of mES cell-derived progeny treated with ML-7 when grown on different topographies. Green – EdU. Blue – DAPI. Green+blue gives turquoise color. Data are mean ± SE. * p< 0.01, # p< 0.05.

