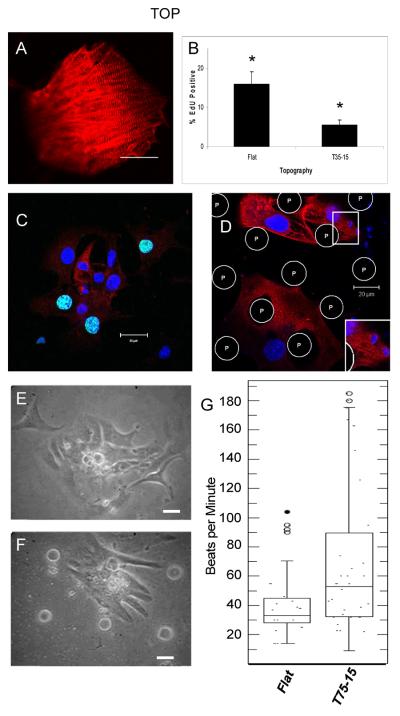
Figure 5. Microprojections affect cardiomyocytes derived from mES cells.
(A) Confocal image of more mature, 7+14 day old mES derived cardiomyocytes have a well-defined sarcomeric structure. (B–D) EdU incorporation and α-actinin expression in immature cardiomyocytes derived from mES cells when grown on (C) flat or (D) T35-15 PDMS membranes. (B) Histogram of mES cell derived cardiomyocyte proliferation on different topographies. (E,F) Phase images of mES cell derived cardiomyocytes on (E) flat or (F) T75-15 PDMS membranes. (G) Beating rates of mES cell derived cardiomyocytes grown on flat and T75-15 PDMS membranes displayed as a box plot to graphically show large difference in distribution between groups. Bottom line of box represents the 25th percentile, the line within box the median and the upper line the 75th percentile. Whiskers signify minimum and maximum values with circles representing outliers. * p< 0.05. Dividing nuclei are turquoise with DAPI (blue) and EdU (green). α-actinin (red). P, microprojections. (A) scale bar 50 μm. (C–F) scale bar 20 μm.

