
Fig. 2.
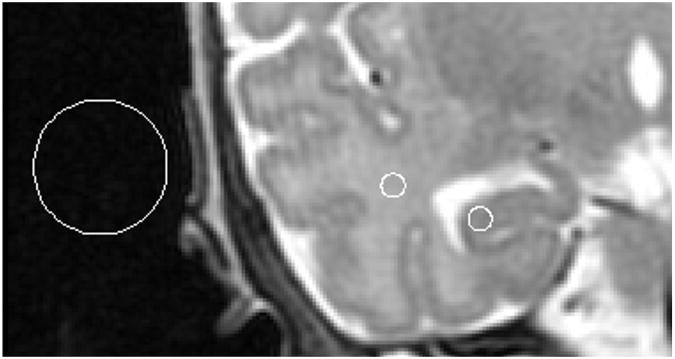
An example of regions of interest from which signal intensities were obtained in order to calculate signal to noise and contrast to noise ratios between hippocampal GM and temporal white matter, overlaid on a T2-PD image.
Official websites use .gov
A
.gov website belongs to an official
government organization in the United States.
Secure .gov websites use HTTPS
A lock (
) or https:// means you've safely
connected to the .gov website. Share sensitive
information only on official, secure websites.
An example of regions of interest from which signal intensities were obtained in order to calculate signal to noise and contrast to noise ratios between hippocampal GM and temporal white matter, overlaid on a T2-PD image.