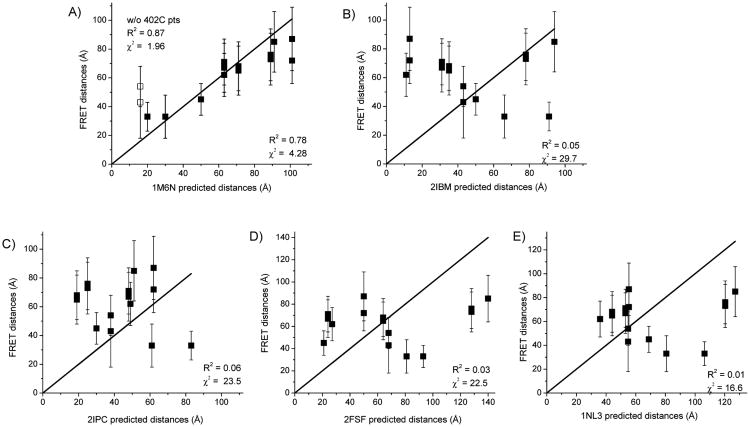
Figure 4.
Correlation between FRET distances and predicted distances from dimer crystal structures. FRET distances are plotted versus those predicted from the indicated SecA X-ray crystal structures. Distances and errors are given in Table 1. The linear solid line depicts the perfect case of a 1:1 correspondence when the FRET distances exactly match the crystal structure distances. The degree of correspondence and goodness of fit are evaluated through parameters, R2 and χ2; all points are evaluated except where indicated. (A) Hunt et al. B. subtilis structure (PDB ID: 1M6N) 21. Distances measured between 402IAE-402IAN and 402AF488-402AF568 are shown with open squares, (B) Zimmer et al. B. subtilis structure (PDB ID: 2IBM) 25, (C) Vassylyev et al. T. thermophilus structure (PDB ID: 2IPC) 24, (D) Papanikolau et al. E. coli structure (PDB ID: 2FSF) 22, and (E) Sharma et al. M. tuberculosis structure (PDB ID: 1NL3) 23.

