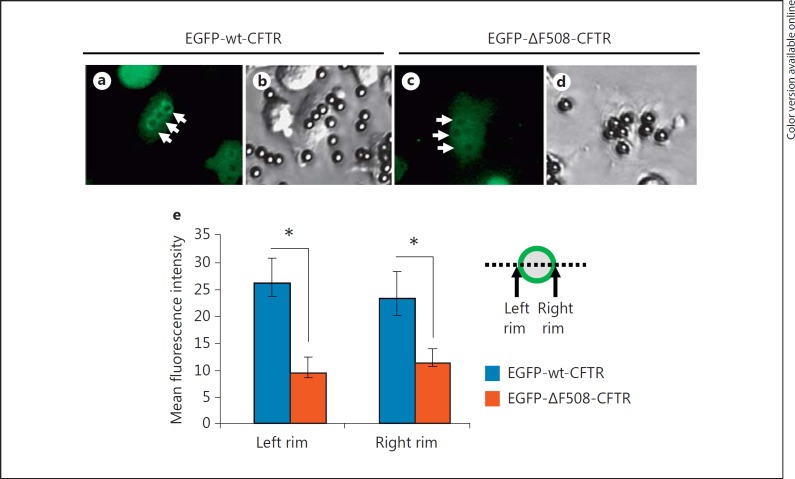
Fig. 4.
Significantly less ΔF508-CFTR fusion protein is associated with phagosomes. The fluorescent (a) and phase-contrast (b) micrographs show EGFP-wt-CFTR association with phagosomes by microscopy. Distinct fluorescent rings are noticeable (a, arrows). Identically prepared cells expressing EGFP-ΔF508-CFTR had little EGFP fluorescence associated with phagosomes (c, arrows). Quantification of the pixel intensity across the phagosomes was profiled. The peak fluorescence intensity of either side of the rim of each phagosome was obtained. After subtraction of the background, the mean net peak fluorescence is displayed and compared between the differentiated EGFP-wt-CFTR and EGFP-ΔF508-CFTR PLB-985 cells (e). Statistical analyses show significant differences, as marked with asterisks, by Student's t test (n = 21; p < 0.01).

