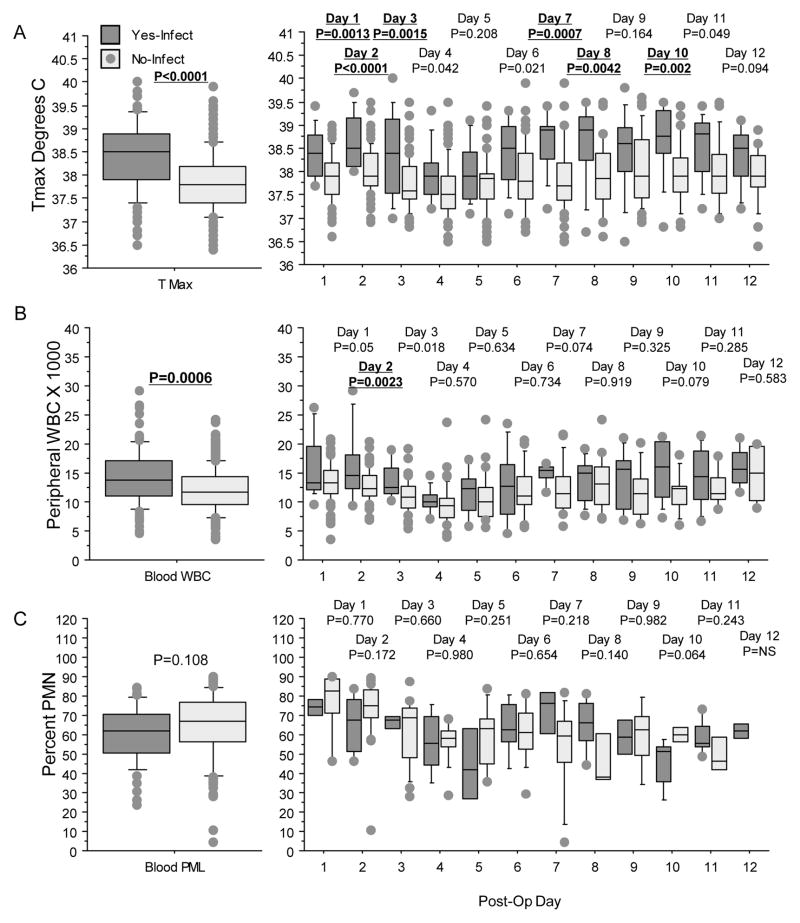
Figure 2.
Box plots displaying maximal daily temperature (A), blood WBC counts (B), and percent blood PMN (C) for those with (dark gray) and without (light gray) infections. Repeated measure ANOVA for all days is shown in the left column and individual days from one to 12 postsurgery shown in the right column. P-values shown above each plot, and significant results (p<0.01) highlighted in bold and underlined. For Tmax (A), repeated measure ANOVA found that those with infections had higher daily temperatures compared with non-infected cases (left graph). This was significant for postsurgery day one, 2,3,7,8, and 10 (right graph). For blood WBC counts (B), repeated measure ANOVA showed that cases with infections had higher counts compared with those without infections (left graph). Only the differences seen on day two postsurgery were significantly different. For blood PMN (C), there were no differences in the repeated measure ANOVA (left graph) and by individual days (right graph).

