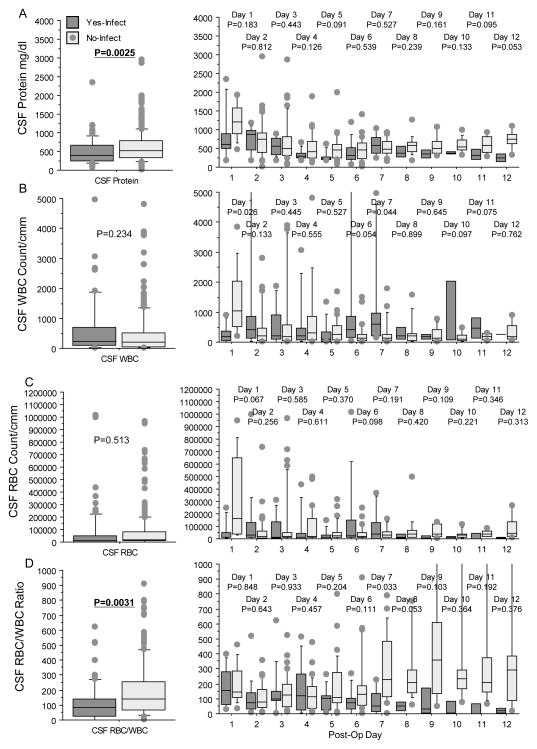
Figure 4.
Box plots displaying cerebrospinal (CSF) protein (A), CSF WBC count (B), CSF red blood cell (RBC counts (C), and CSF RBC/WBC ratio (D) for those with (dark gray) and without (light gray) infections. Columns and p-values displayed as in Figures 2 and 3. For CSF protein (A), repeated measure ANOVA showed that those with infections had lower protein levels compared without infections (left graph). Inspection by each day postsurgery showed no difference for any particular day and the difference was a general trend over time. For CSF WBC (B) and RBC counts (C), there were no differences in the repeated measure ANOVA (left graph), and considerable variability each day postsurgery (right graph). For CSF RBC/WBC ratios (D), repeated measure ANOVA showed lower ratios for those with infections compared with no infections (left graph). However, review of individual days showed that this was a general trend, especially after day 7, and there was considerable variability within groups over time.

