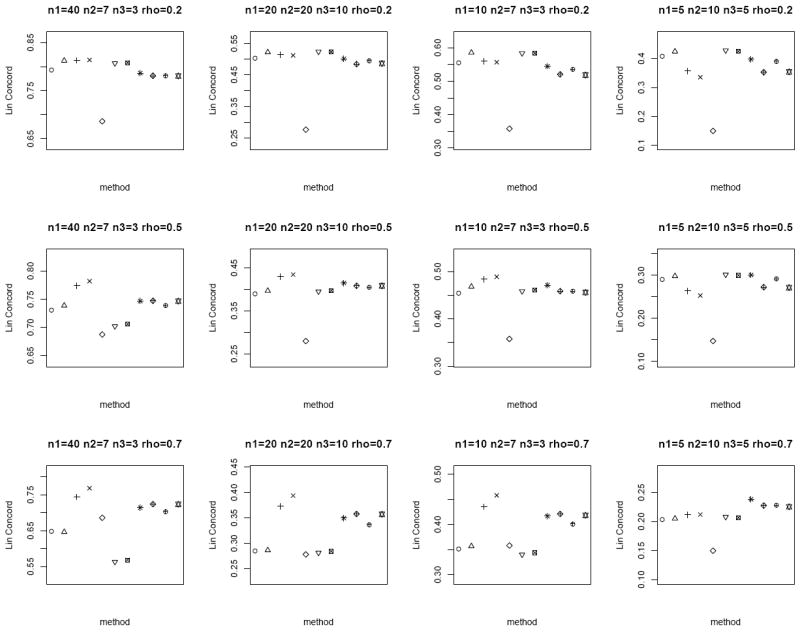
Figure 2.

Average rc of the different methods under the heteroscedastic bivariate Gaussian simulation setup. Each panel corresponds to a different (n1, n2, n3, ρ) combination. The plotting symbols (from left to right) correspond to ○:modified t-statistic, Δ:corrected Z-test, +:MLE based test of Ekbohm [5], ×:MLE based test of Lin and Stivers [4], ◇:paired t-test on the n1 matched samples only, ▽:two-sample t-test on n1 + n2 and n1 + n3 observations under the homoscedasticity assumption, ⊠:two-sample t-test on n1 + n2 and n1 + n3 observations under the heteroscedasticity assumption, ✳:weighted Z-test using square root of sample sizes weighting under the homoscedasticity assumption,
 :weighted Z-test using inverse of estimated standard error weighting under the homoscedasticity assumption, ⊕:weighted Z-test using square root of sample sizes weighting under the heteroscedasticity assumption, ✡:weighted Z-test using inverse of estimated standard error weighting under the heteroscedasticity assumption. The estimated standard errors of average rc are in the order of < 10−3.
