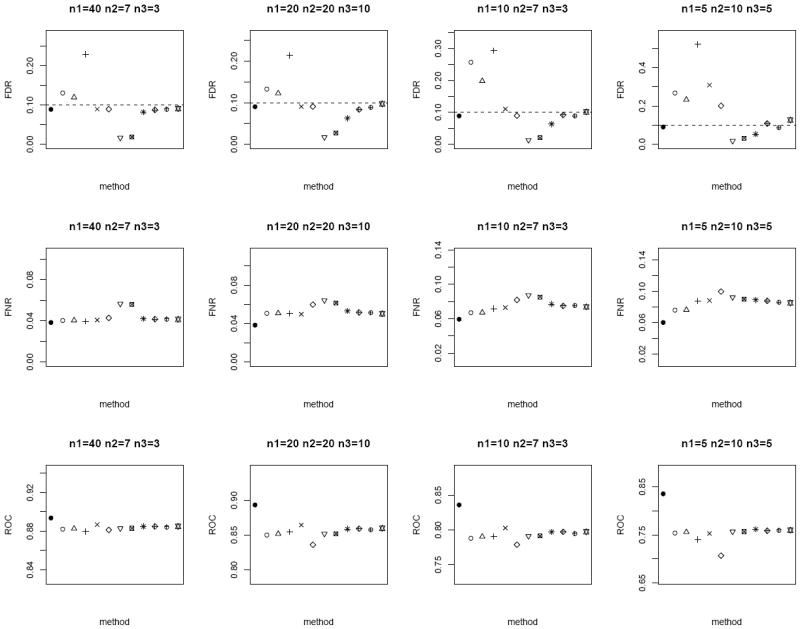
Figure 4.

Average FDR (top row), FNR (middle row) and ROC (bottom row) of the different methods under the heteroscedastic bivariate Gaussian simulation setup. Dotted horizontal lines in the top row correspond to the nominal FDR level of 0.1. Each panel corresponds to a different (n1, n2, n3) combination. The plotting symbols (from left to right) correspond to ●:oracle test, ○ :modified t-statistic, Δ:corrected Z-test, +:MLE based test of Ekbohm [5], ×:MLE based test of Lin and Stivers [4], ◇:paired t-test on the n1 matched samples only, ▽:two-sample t-test on n1 + n2 and n1 + n3 observations under the homoscedasticity assumption, ⊠:two-sample t-test on n1 + n2 and n1 + n3 observations under the heteroscedasticity assumption, ✳:weighted Z-test using square root of sample sizes weighting under the homoscedasticity assumption,
 :weighted Z-test using inverse of estimated standard error weighting under the homoscedasticity assumption, ⊕:weighted Z-test using square root of sample sizes weighting under the heteroscedasticity assumption, ✡:weighted Z-test using inverse of estimated standard error weighting under the heteroscedasticity assumption. The estimated standard errors of all the statistical measurements (FDR, FNR, ROC) are in the order of < 10−3.
