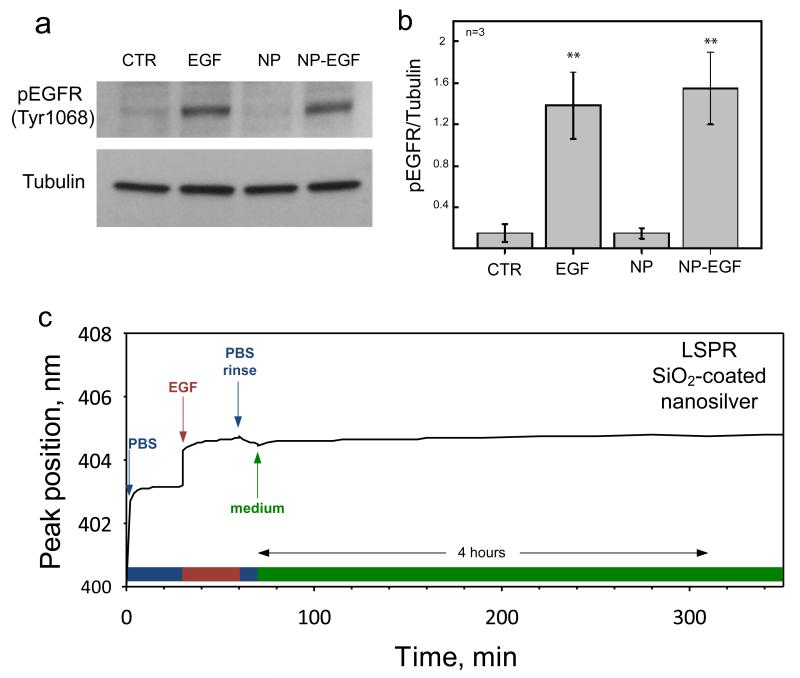
Figure 7.
Western blot analysis of EGFR activation in VE11 mouse melanoma cells by EGF-functionalized Y2O3:Tb3+ nanophosphors. (a) The activation of EGFR is revealed through the quantification of EGFR phosphorylation in Tyr1068 (upper band) relative to the loading control (lower band). (b) Quantification of Western Blot band intensity from three independent experiments. Significant differences between the population means and the control are reported (** indicate p < 0.01). (c) Time evolution of the plasmon peak position of a localized surface plasmon resonance (LSPR) biosensor with SiO2-coated nanosilver23 mounted on a flow-cell. Initially, the biosensor signal is stabilized in the presence of the buffer solution (PBS). Then, the EGF-containing solution is injected, shifting the peak position to higher wavelength. This shift is maintained after the rinsing with buffer (PBS rinse) and incubation with cell medium (medium) for a period over 4 hours.

