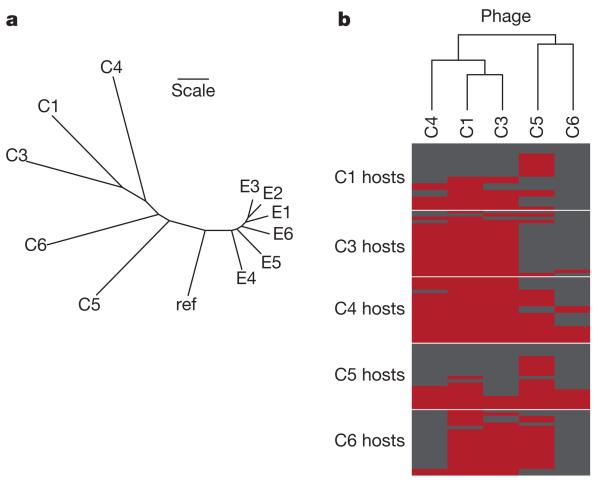
Figure 1. Genetic and phenotypic responses to selection.
a, Phylogenetic tree for evolved (E1–6) and coevolved (C1, C3–6) phage populations and ancestral reference genotype (ref) based on Euclidean distances calculated from the frequency and identity of mutations in each population. Scale bar indicates a Euclidean distance of one. b, The phage-infectivity range based on the ability of each coevolved population to infect 20 bacterial clones from each host population. Infection by phage is shown in red, and resistance by hosts is shown in grey. The dendrogram indicates phenotypic similarity between phage populations.

