
Figure 1.
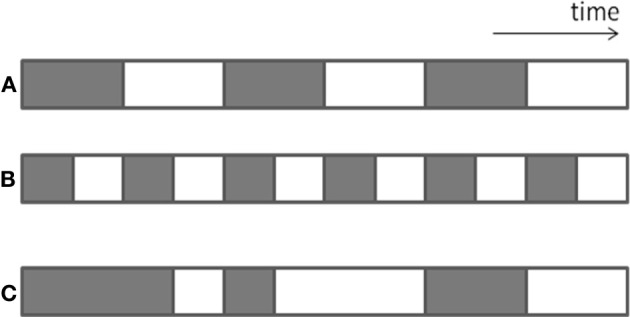
Graphical representation of differences in distribution of length of bouts and variability in bout length. The gray bars indicate sedentary behavior (sitting).
Official websites use .gov
A
.gov website belongs to an official
government organization in the United States.
Secure .gov websites use HTTPS
A lock (
) or https:// means you've safely
connected to the .gov website. Share sensitive
information only on official, secure websites.
Graphical representation of differences in distribution of length of bouts and variability in bout length. The gray bars indicate sedentary behavior (sitting).