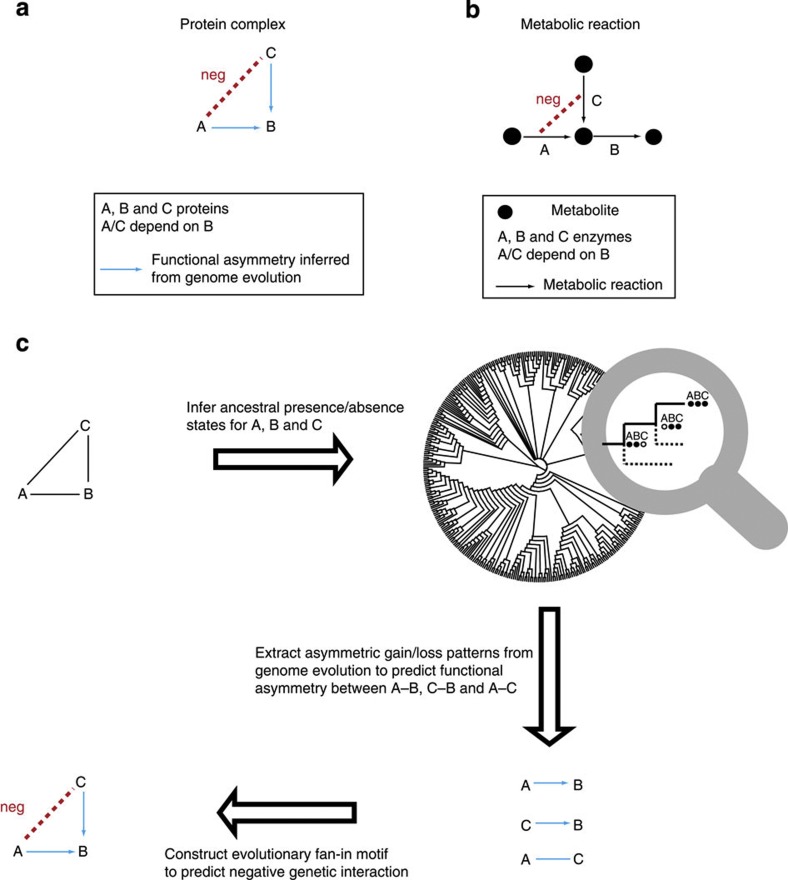
Figure 1. Functional asymmetry and negative genetic interactions are linked.
(a) Protein A and B have an asymmetric functional relationship, where the function of A depends on B but not vice versa. The asymmetry between protein A and B can be owing to the presence of protein C, which can compensate for a mutant of A. In such a scenario, proteins A and C are predicted to have a negative genetic interaction. (b) Functional asymmetry between enzyme A and B involved in a branched pathway in a metabolic network (A depends on B, but not vice versa: A→B). Nodes and arrows represent metabolites and reactions, respectively. The asymmetric relationship is owing to a converging reaction catalysed by enzyme C, which can compensate for A’s absence. Thus, enzyme A and C are likely to have a negative genetic interaction. (c) Flowchart to predict negative genetic interactions from genome evolution within a three-member protein complex (protein A, B and C). The blue arrow represents the functional asymmetry between two genes inferred from genome evolution. The blue line represents that there is no evolutionary evidence for a functional asymmetry between two genes. Here, both gene A and C are predicted to have functional asymmetry with B, while gene A and C are predicted not to have functional asymmetry.

