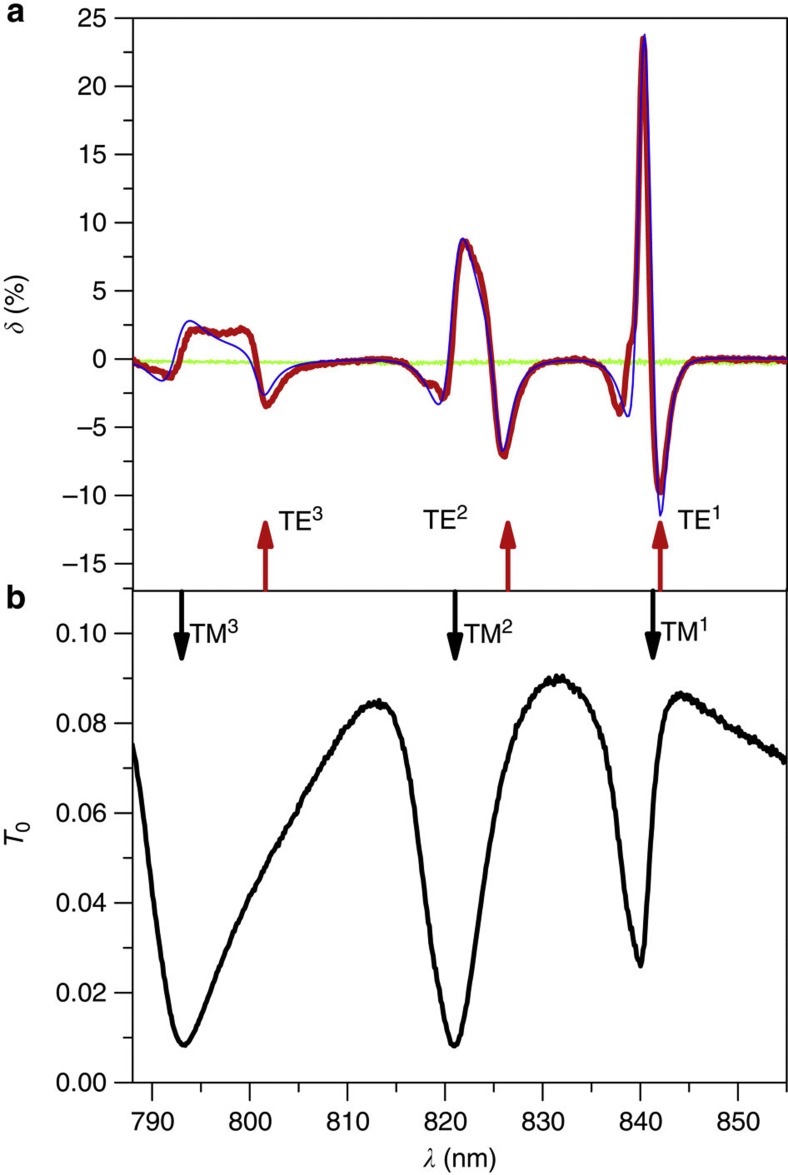
Figure 2. Experimentally measured magneto-photonic effect for modulating the intensity of the transmitted light.
(a) Spectrum of the LMPIE when a magnetic field B=320 mT reaching almost the saturation value is applied. Blue curve shows calculated δ. There is no LMPIE for the bare magnetic film (green curve). (b) Spectrum of the optical transmittance for the demagnetized structure. Black and red arrows indicate calculated spectral positions of the quasi-TM and quasi-TE resonances, respectively. The modes are denoted by the number of their Hy or Ey field maxima along the z axis. The light is TM-polarized and hits the sample under normal incidence. All measurements were performed at room temperature. The MPC sample parameters are: d=661 nm, hgr=67 nm, r=145 nm and hm=1,270 nm (see Fig. 1a).

