Figure 1.

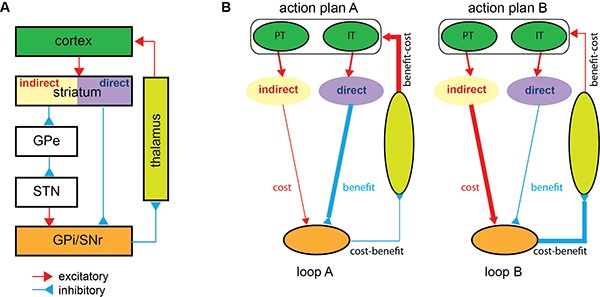
(A) The cortico-basal ganglia-cortico loop (Albin et al., 1989). Most cortical areas send excitatory projections to the striatum. The striatal projection neurons expressing D2 dopamine receptors transmit the cortical signal indirectly to the internal globus pallidus (GPi)/substantia nigra pars reticulate (SNr) via the external globus pallidus (GPe) and subthalamic nucleus (STN). The striatal projection neurons expressing D1 dopamine receptors transmit the cortical signal directly to the GPi/SNr. The GPi/SNr sends inhibitory projections to the thalamic nuclei, which then send excitatory projections back to the cortex. The red lines indicate excitatory connections, and the blue lines indicate inhibitory connections. Note that only principal pathways and not all identified connections are shown. (B) The cost-benefit model. An illustration of a simple scenario in which two action plans, A and B, compete. Two cortico-basal ganglia-cortico loops that are topologically organized, each linking a particular cortical ensemble with a particular set of basal ganglia neurons, operate in parallel. In loop A, (1) action plan A is represented by a set of intra-telencephalic (IT) and pyramidal tract (PT) neurons in the cortex, (2) indirect pathway neurons, preferentially processing PT neuronal input, produce the expected cost of plan A, and direct pathway neurons, preferentially processing IT neuronal input, produce the expected benefit of plan A, and (3) the basal ganglia output neurons combine the two pathways in a subtractive manner to represent the net cost-benefit of plan A. Likewise, in loop B, the basal ganglia output neurons represent the net cost-benefit of plan B. Action plan A producing the better prospective net value sustains through the strong re-entrant feedback signal from the basal ganglia to the cortex, whereas action plan B perishes. Although not depicted, the two pathways receive sensory cortical inputs so that the cost and benefit analysis draws on the sensory state information as well. GPe and STN are also omitted for brevity. The same color scheme as in (A) is used for different brain areas, and the line thickness indicates the signal strength.
