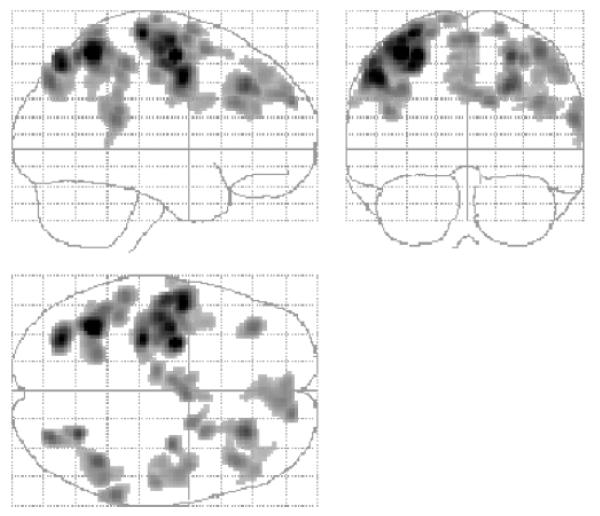
Fig. 4.
SPM {Z}s representing regions in which there is a negative correlation between RCAH and task-related signal change.
Results are displayed on a ‘glass brain’ shown from the right side (top left image), from behind (top right image), and from above (bottom left image). Voxels are significant at P < 0.001 (uncorrected), and clusters are significant at P < 0.05 (corrected), for the purposes of display.

