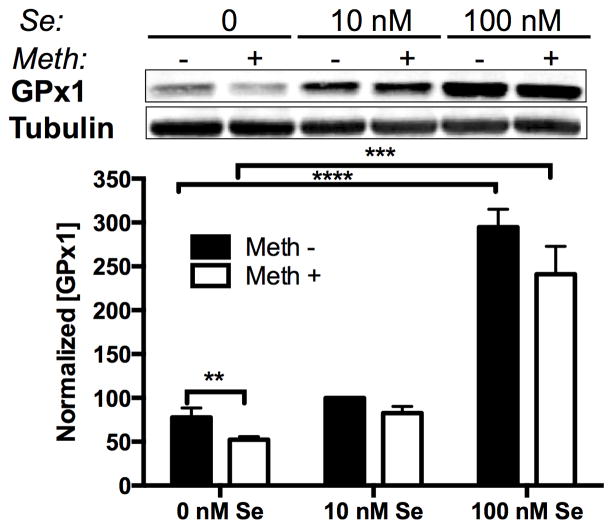
Figure 2.
Methamphetamine and selenium alter GPx1 protein levels. Above: Representative western blot of GPx1 from SH-SY5Y cells grown in media containing 0, 10, or 100 nM Se, with or without 100 μM Meth. Four replicate cultures for each condition were measured. Below: Graph of GPx1 protein mean ± SEM measured by optical density of western blot bands. Bars show mean ± SEM for four replicate cultures per condition. ** indicates p<0.01, *** indicates p<0.001, and **** indicates p<0.0001 (Two-Way ANOVA with Bonferoni’s posthoc test).

