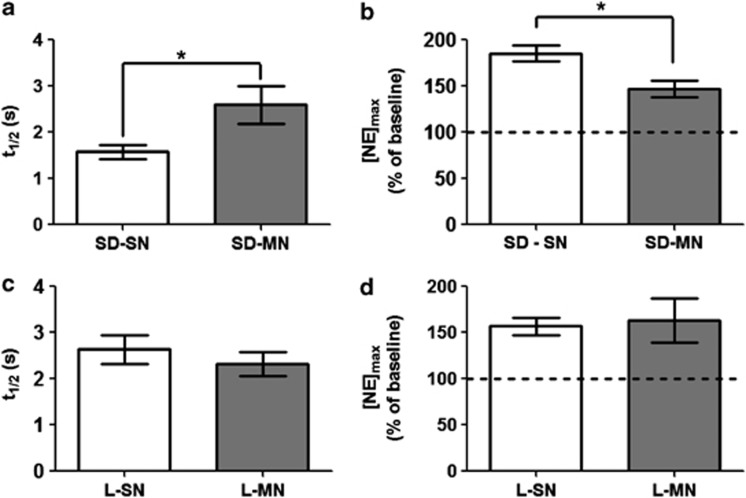
Figure 5.
Clearance half-life and change in response following idazoxan (IDA) administration in morphine/naloxone (MN) animals vs saline controls. (a) t1/2 and (b) change in [NE]max as percent of pre-drug baseline in MN Sprague-Dawley (SD) rats vs saline controls (P<0.05). (c) t1/2 and (d) change in [NE]max as percent of pre-drug baseline in MN Lewis (L) rats vs saline controls (n.s.). SN, saline/naloxone.

