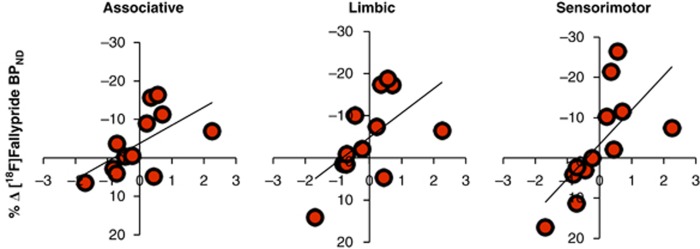
Figure 4.
The relationship between changes in cue-induced craving factor score (x axis) and percent changes in [18F]fallypride BPND (y axis) across the test sessions in striatal ROIs (N=12). Associative striatum (r=0.589, p=0.044), ventral limbic striatum (r=0.581, p=0.048), and sensorimotor striatum (r=0.675, p=0.016).

