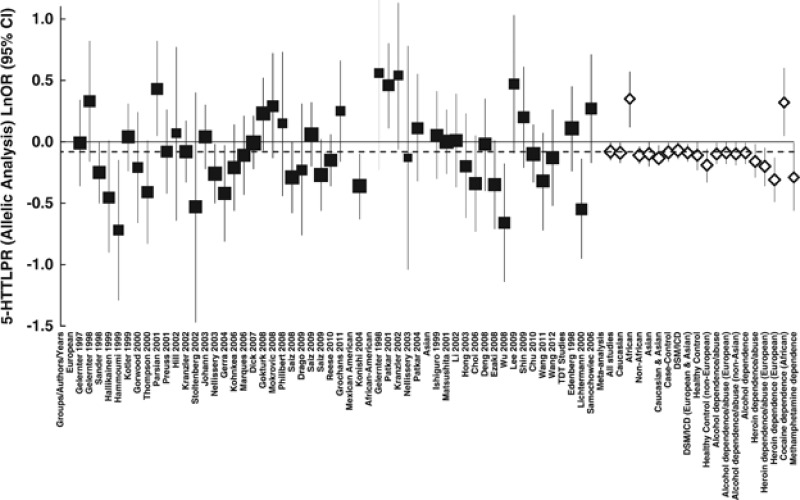
Figure 3.
Forest plots of ln(OR) with 95% CI for the 5-HTTLPR allelic analysis. Black squares indicate the ln(OR), with the size of the square inversely proportional to its variance, and horizontal lines represent the 95% CIs. The pooled results are indicated by the unshaded black diamond. For the results of meta-analysis, only the subgroups with P<0.05 are shown.

