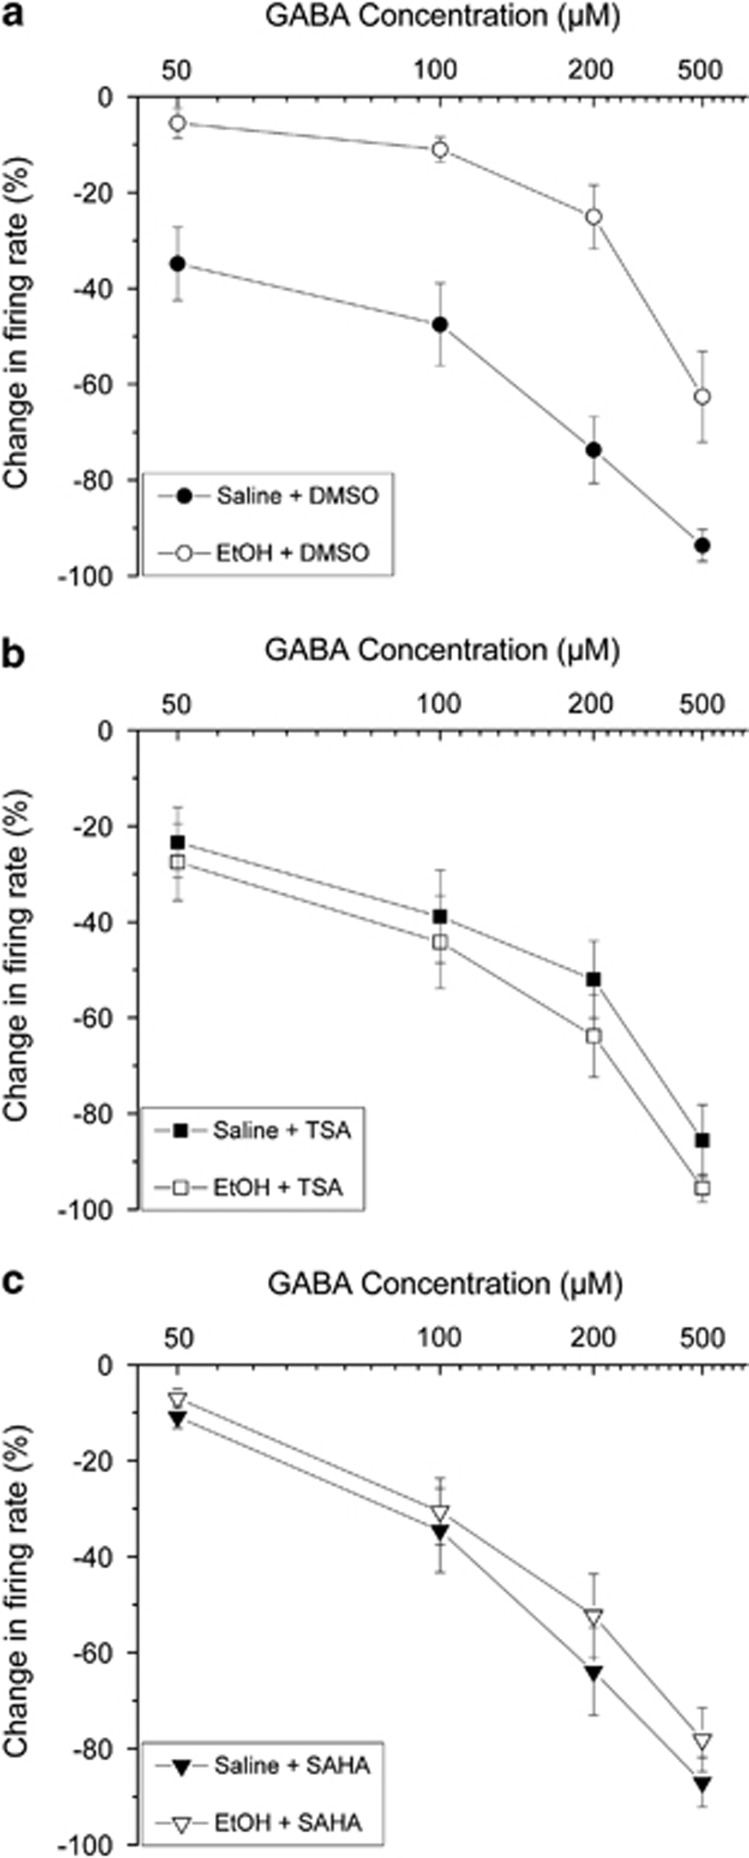
Figure 2.
Pooled responses: effects of GABA. Pooled concentration–response curves for pDAergic VTA neurons from brain slices from mice treated with repeated injections of either saline (filled symbols) or ethanol (open symbols). Slices were incubated for 2 h with 0.1% DMSO (a), 12.5 μM TSA (b), or 3 μM SAHA (c). (a) Incubation in DMSO (vehicle controls): slices from saline-treated (•) or ethanol-treated mice (○); (b) incubation in TSA: slices from saline-treated (▪) or ethanol-treated mice (□); (c) incubation in SAHA: slices from saline-treated (▾) or ethanol-treated mice (∇).

