Figure 3.
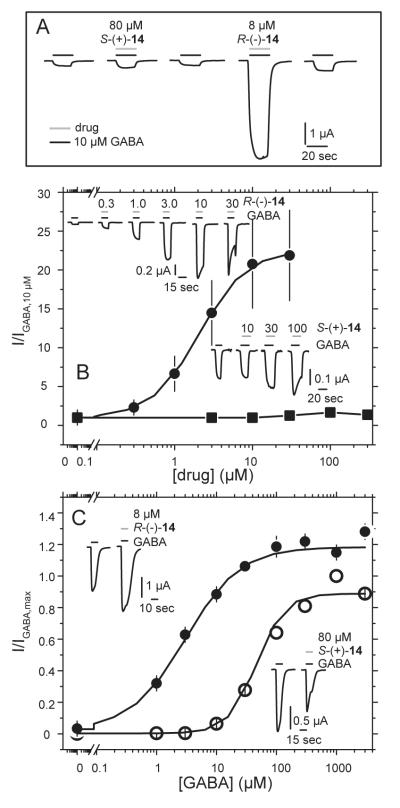
Stereoselective action of R-(−)-14 and S-(+)-14. (A) Two electrode voltage clamp was used to measure currents from oocytes injected with human α1β2γ2L GABAA receptor subunits. Currents were elicited with 10 μM GABA (black bar) and twice the anesthetic dose of each compound sequentially applied to the same oocyte: 80 μM S-(+)-14 or 8 μM R-(−)-14 (grey bars). (B) 10 μM GABA currents were potentiated with increasing amounts of R-(−)-14 or S-(+)-14. Solid lines represent the non-linear least squares fit to the data. For R-(−)-14 (circles): EC50 = 2.1 ± 1.2 μM, nH = 1.4 ± 0.5, Imax = 23 ± 5 (data from 2 oocytes). 10 μM GABA current traces from a typical oocyte are shown in top inset with increasing amounts of R-(−)-14. S-(+)-14 (squares) was tested up to 300 μM (squares) and data could not be similarly fit. Traces from a typical oocyte in lower inset represent 10 μM GABA plus increasing amounts of S-(+)-14. (C) GABA concentration response curves shift to the left in the presence of R-(−)-14. Data is shown from one representative oocyte. Solid lines represent the non-linear least squares fit to the data: for GABA: EC50 = 46 ± 1 μM, nH = 1.8 ± 0.1, Imax = 0.9 ± 0.01 (open circles). In the presence of 8 μM R-(−)-14: EC50 = 3.1 ± 0.1 μM, nH = 1.0 ± 0.1, Imax = 1.2 ± 0.01 (closed circles). Currents were normalized to the maximal GABA response. Current traces in upper inset show the effect of 8 μM R-(−)-14 on 3 mM GABA current responses. Traces in lower inset show effect of 80 μM S-(+)-14 on 1 mM GABA currents.

