Figure 2.

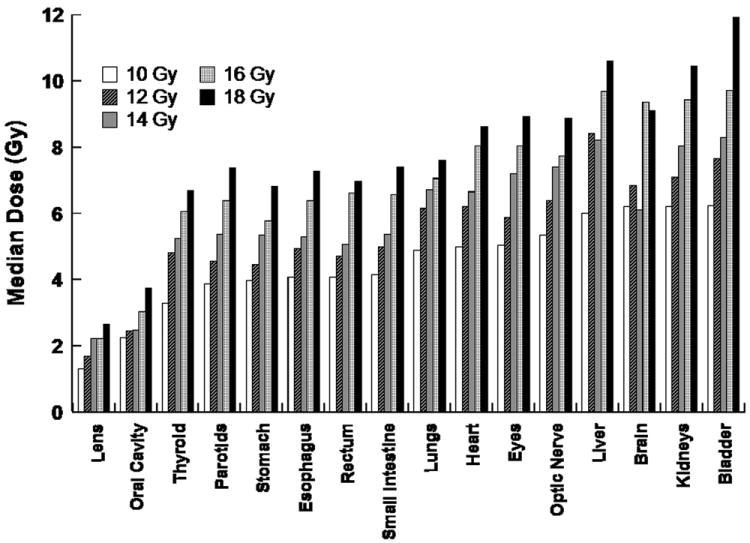
Median Organ Doses with TMI. Median (D50) dose for each organ compartment is shown. Bar graphs represent an average of the dose for the 3-6 patients at each TMI dose level.

Median Organ Doses with TMI. Median (D50) dose for each organ compartment is shown. Bar graphs represent an average of the dose for the 3-6 patients at each TMI dose level.