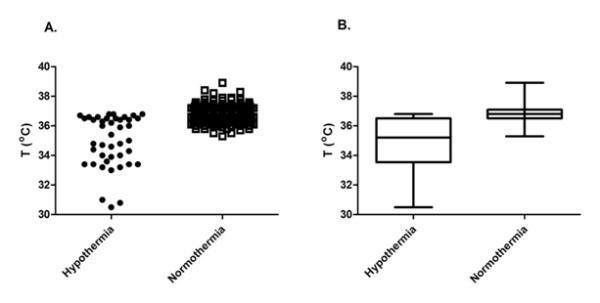
Figure 1.

Temperatures recorded nearest to the phenobarbital plasma concentration measurements are presented for the hypothermia and normothermia (control) groups. Panel A demonstrates the range of temperatures at which the phenobarbital concentrations were sampled. In the hypothermia group, there are three groups of several data points: there is a cluster less than 32°C, suggesting over-cooling that may have occurred during the initial phases of hypothermia (for example during transport); there are many data points between 33°C and 35°C, implying the interval during hypothermia in our NICU; finally, there are data points above 36°C, which represent the rewarming period. Panel B displays boxplots of the same temperature data. The length of the boxes represents the interquartile range, while the horizontal line in the box is the median value and the whiskers indicate the minimum and maximum data points.
